


Resistance Rejection Raises Short-Term Pressure
Natural gas advanced to an eight-day high of around $3.36 on Wednesday, as it again tested the recent resistance zone. Sellers regained control from that high, leading to an intraday decline to new lows for the day. At the time of writing, the current low of $3.20 was testing support near the 20-day moving average near $3.21, and it will result in a higher daily low for the day if support holds into the close.
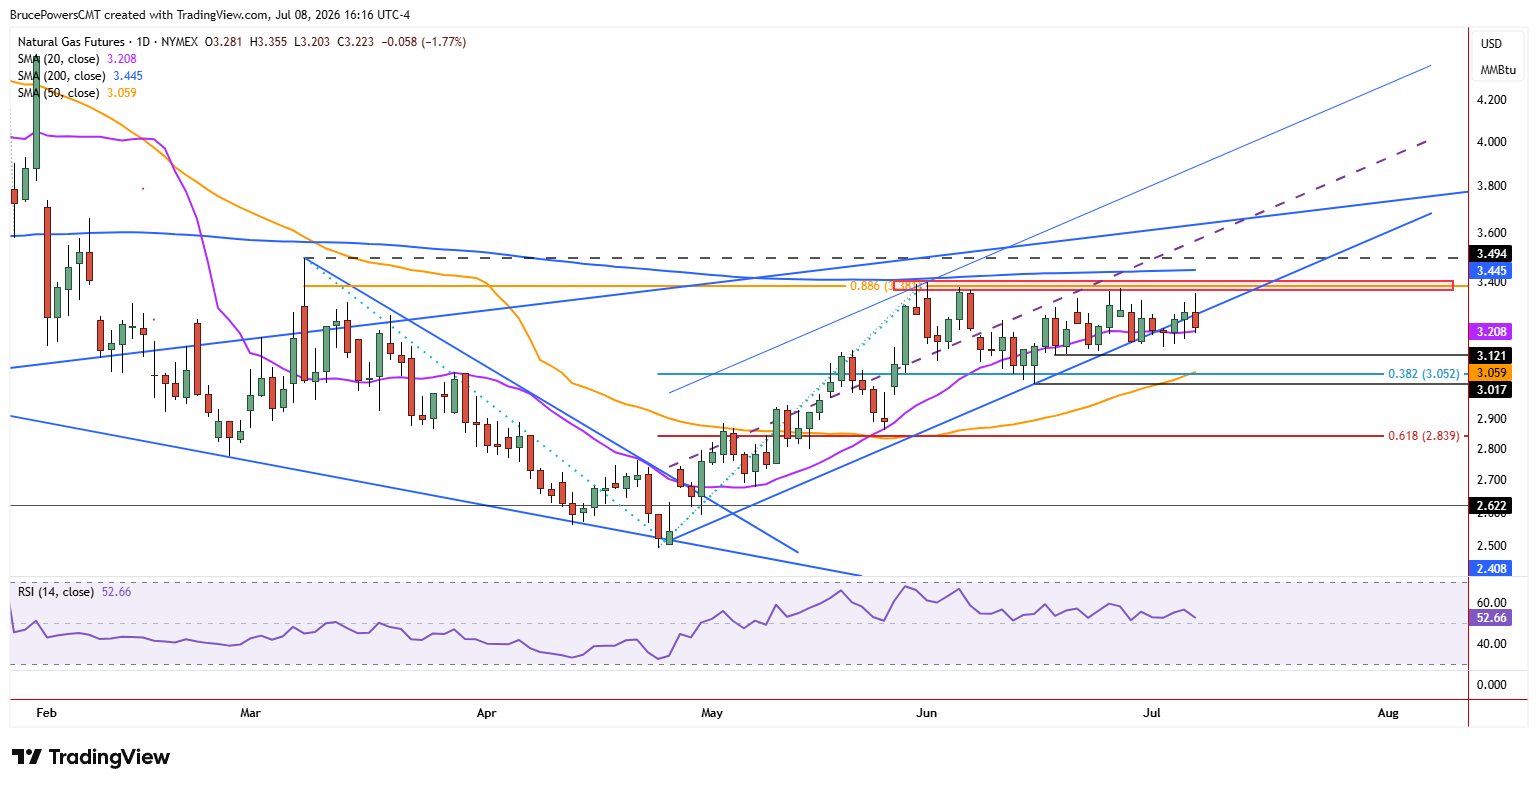
However, renewed downward pressure is signaled by Wednesday’s bearish price action. Although natural gas appears likely to hold initial support near the 20-day moving average, it will show weakening by closing below the uptrend line, reflecting a failure to recover the trendline as support. This would indicate that trendline support remains at risk of failure. Given the reaction near the trendline over the past seven trading sessions, a breakdown may lead to further consolidation rather than a sustained reversal of trend.

Moving Averages Define Next Support Zone
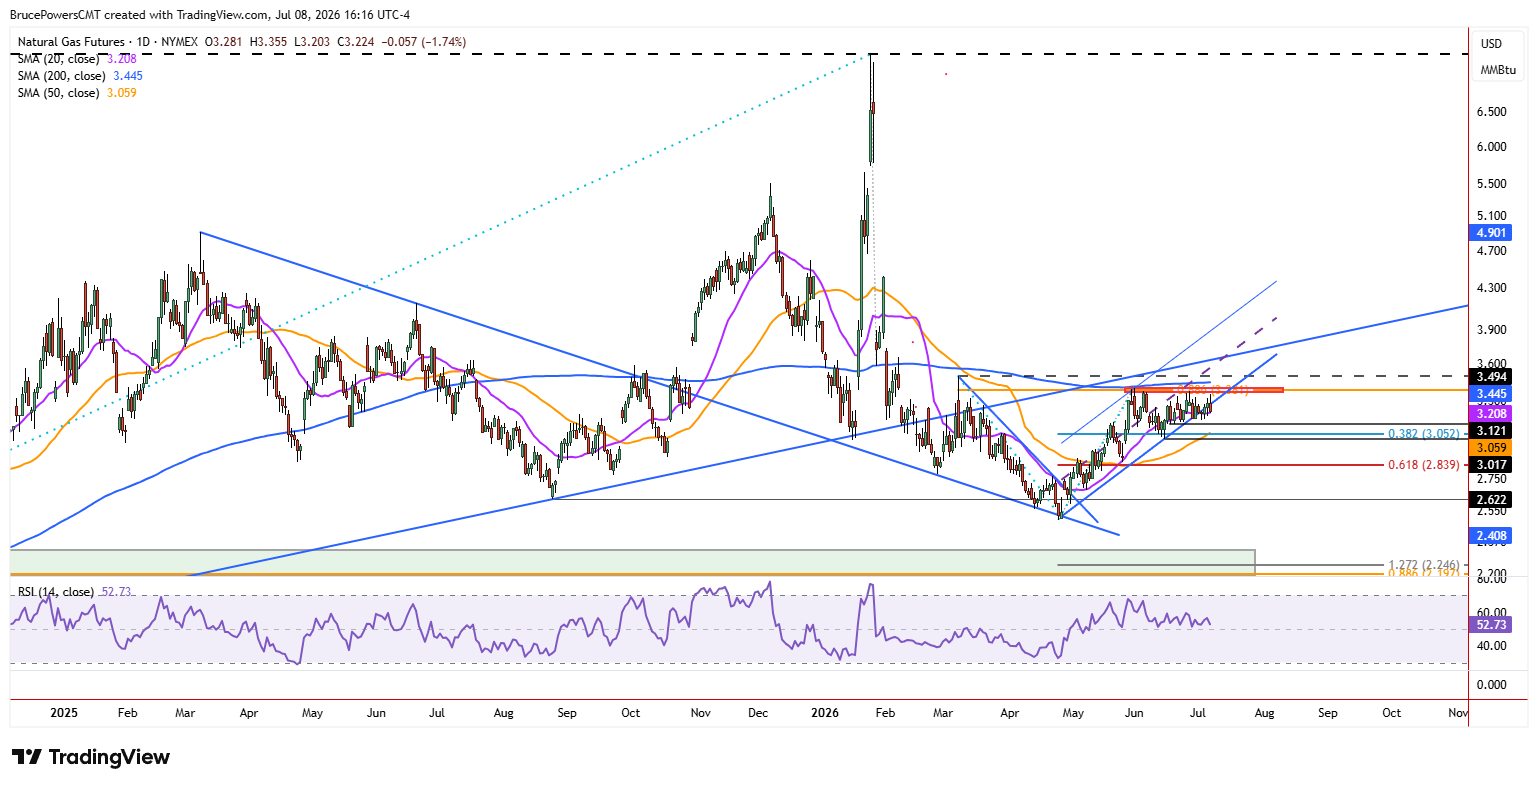
Key near-term support is at the interim swing low of $3.12. However, if this price zone is tested and fails to hold as support, there is a good chance lower levels will be tested. The rising 50-day moving average at $3.06 is key dynamic support, and a clear break below the 20-day moving average would shift attention toward the 50-day average as the next moving average target. It has additional significance since it was confirmed as trend support during a pullback in May. While the 200-day moving average was approached once near the June trend high, it defines initial upside resistance, while dynamic support is represented by the 50-day moving average.
Longer-Term Structure Remains in Focus
Beyond the moving averages, key structure support is defined by the higher swing low of $3.02 from June. It is notable that dynamic support represented by the 20-week moving average reinforces potential support near the low. Currently, it is near $3.00. Therefore, the reaction from the current support zone will be important, as a breakdown would expose a deeper retracement while a successful defense could help restore upward momentum toward the recent resistance zone.
If you’d like to know more about how to trade natural gas, please visit our educational area.


