


Oil Spike and Fed Minutes Crushed Silver Longs
Spot Silver got hit from both sides Wednesday. Crude oil ripped higher after President Trump declared the Iran ceasefire effectively over, and the FOMC minutes landed hawkish enough to kill whatever was left of the rate-cut trade. The combination sent yields higher, put a bid under the dollar, and triggered a broad liquidation that took silver through multiple support levels before buyers showed up.

Crude Took the Rate-Cut Trade Apart Before the Fed Even Spoke
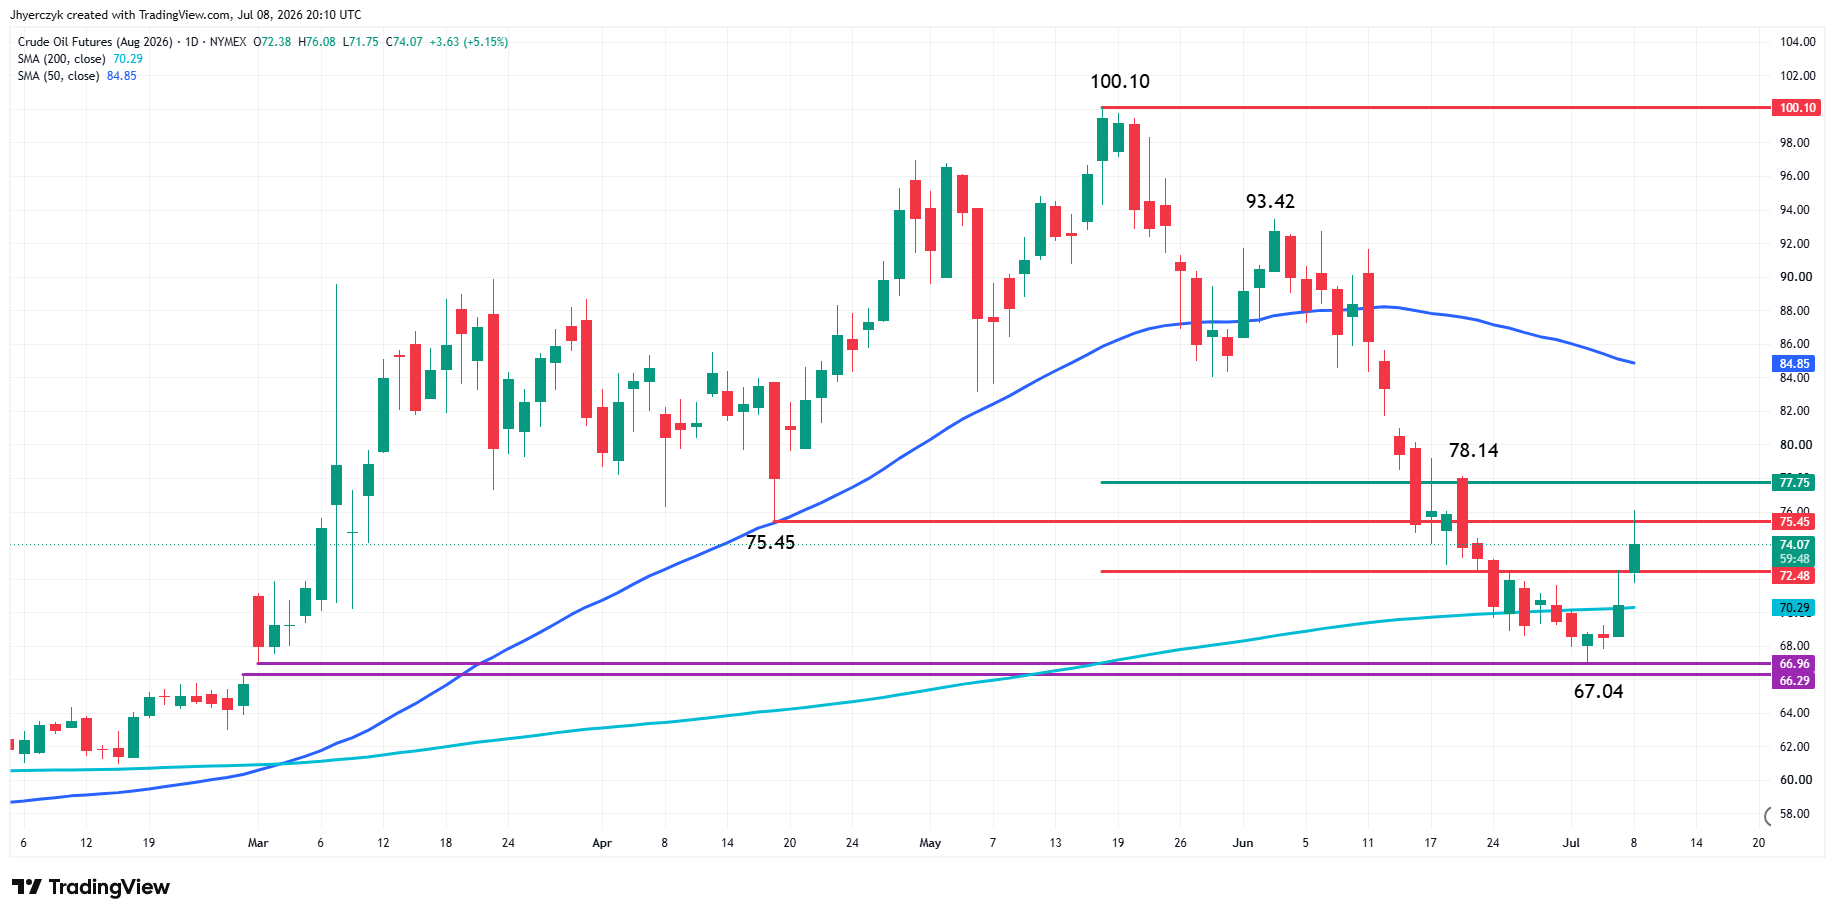
Trump declared the temporary peace agreement with Iran effectively over Wednesday afternoon. Renewed military activity in the Persian Gulf and additional tanker incidents near the Strait of Hormuz were behind the decision. Brent cleared $79. WTI ran above $75.
Silver traders did not wait for the FOMC minutes to react. The post-payrolls longs built on last week’s weak jobs number were the first to go. Those positions needed a path toward rate relief to survive. Oil above $75 closed that path. Treasury yields climbed, the dollar bid strengthened, and the selling ran through the entire afternoon session without a meaningful bounce.
The gold-silver ratio widened all day. Money went into gold and came out of silver. That is the trade every time the market reprices toward higher-for-longer. Gold absorbs it. Silver doesn’t.
June Minutes Closed Every Door the Payrolls Report Opened
Silver Price Forecast
Every new Silver analysis as it publishes, today's technical signal and key levels, live price — on one page.
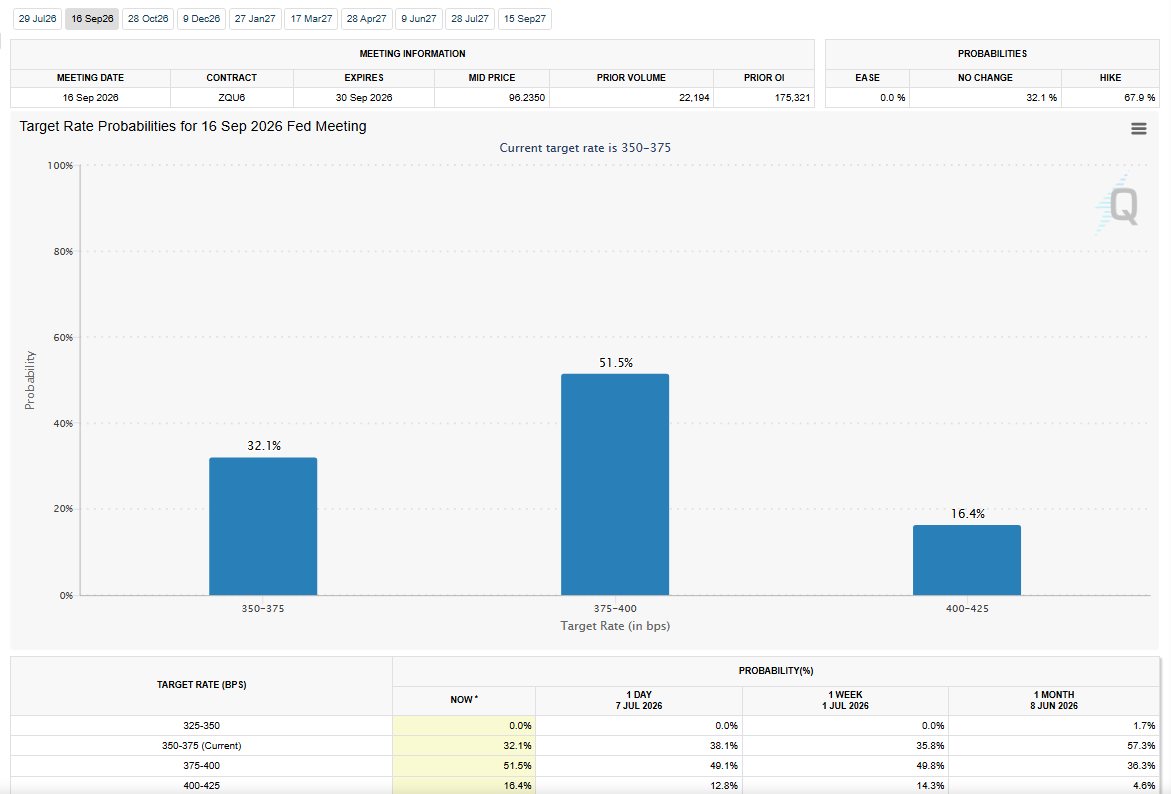
See all Silver forecastsThe committee held rates at 3.50% to 3.75% unanimously at the June 16-17 meeting. That was expected.
What was not expected was the tone underneath the decision. Staff pushed inflation forecasts higher for both 2026 and 2027. Higher energy costs, tariff pass-through, and Middle East supply disruptions all made the list. Rising electricity demand from AI data centers showed up in the projections for the first time as a contributor to price pressure.
The growth picture barely moved. The economy was still running strong enough to keep policy restrictive and several participants said additional rate increases could become appropriate if inflation proves more persistent than projected.
The minutes landed at 18:00 GMT while Brent was already above $79. Traders read the energy-inflation language and the hike discussion together. The dollar extended, yields held their session highs, and the silver selling that started on the oil move accelerated into the close. Last Friday’s payrolls miss gave silver bulls one week of hope. Wednesday’s minutes took it back.
Daily Spot Silver (XAGUSD) Technical Analysis
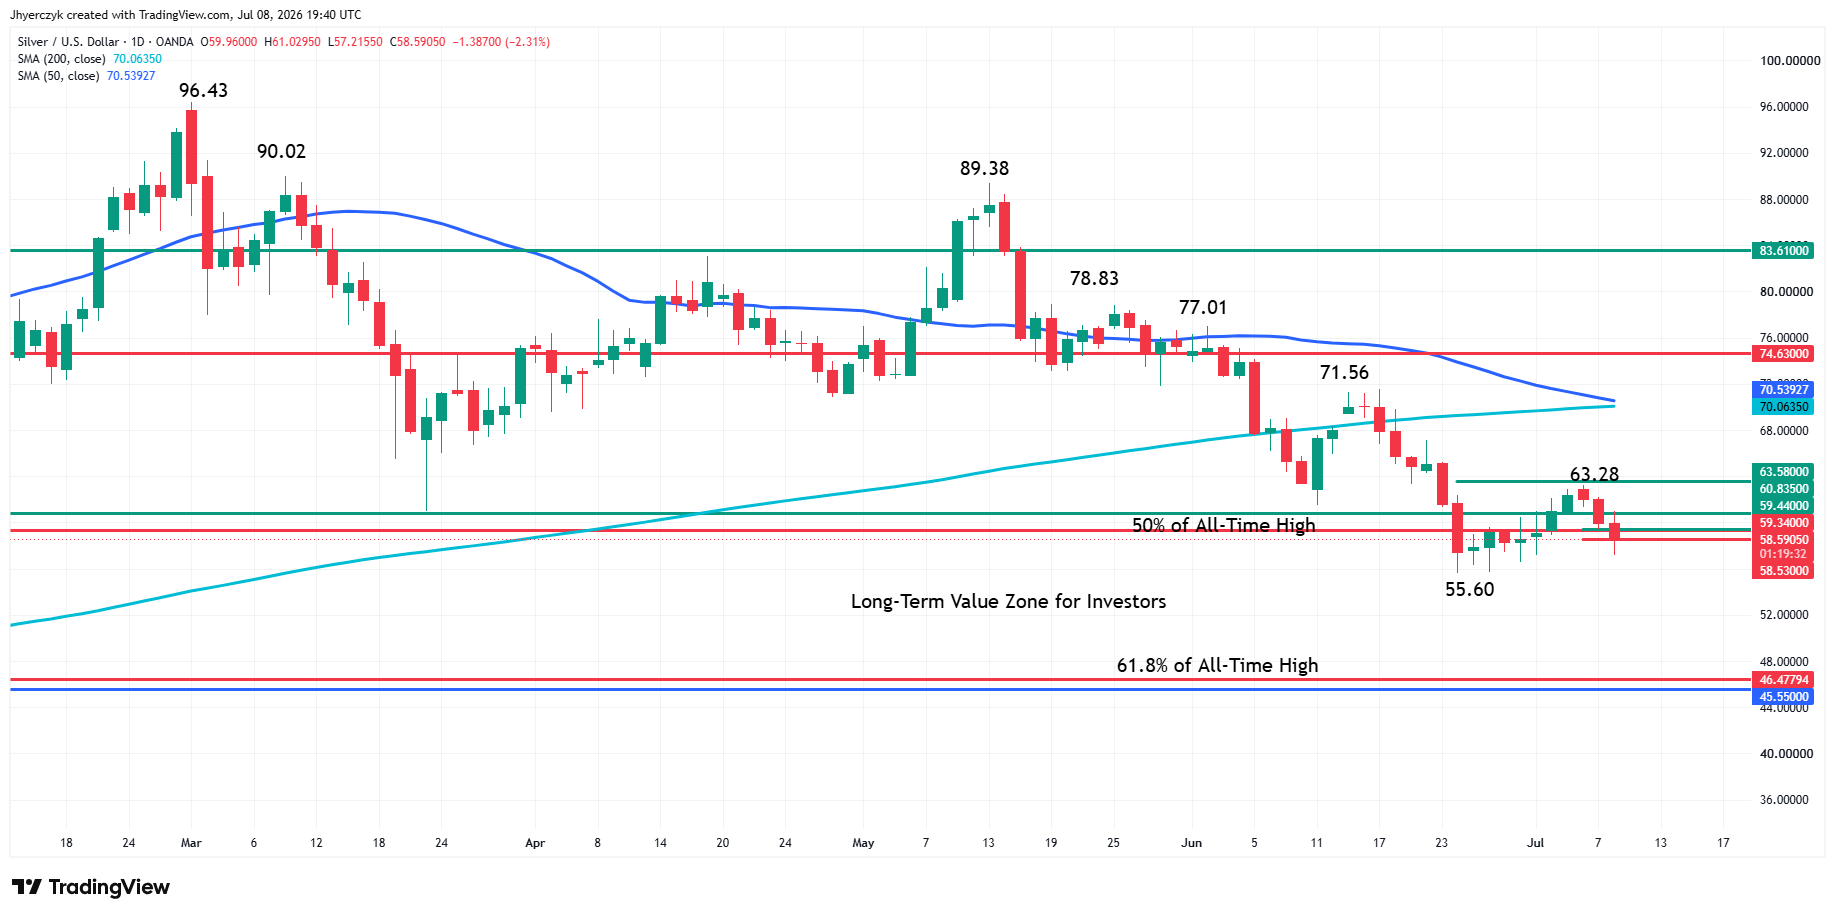
Late in the session on Wednesday, spot silver is trading sharply lower, but traders are still respecting the short-term chart structure.
The main trend is down according to the daily swing chart, but at least we can see the upside breakout level clearly after three days of selling pressure.
The new short-term range is $55.60 to $63.28. Inside this range is the $59.44 to $58.53 retracement zone. Holding this zone will indicate that aggressive counter-trend buyers are trying to establish support. If they fail, we’re likely to see a test of the main bottom at $55.60. If they are successful, then buyers will make another run at $63.28. Take out this level and the short-term trend changes to up with the focus shifting to the 200-day moving average at $70.06 and the 50-day moving average at $70.53.
The longer-term picture is all about value. But this is mostly for the silver investor, not the silver trader. Long-term investors see a major value zone at $60.83 to $46.48. It’s a wide range, but that’s what you get when your all-time high is $120.67. The longer-term investor has the time to build a position inside the support zone.
The problem is, he’s playing against the short-term trader. If the short-term trader can establish a new support base like I wrote about earlier, then with the help of the long-term investor, there’s hope for an upside breakout over $63.28.
From both the short-term trader and the long-term investor, the 200-day MA at $70.06 and the 50-day MA at $70.53 could be a problem. Not only are they potential resistance, but also a major barrier to the uptrend. This area has to be cleared to get the institutional bullish traders on the same side as the retail bull and the long-term investor.
The real test is whether all three groups line up. The long-term investor is buying value. The short-term trader is looking for a base. Institutional money needs both of them to clear the moving averages before it commits. Until that happens, Spot Silver consolidates between $55.60 and $63.28.
What to Watch
Brent above $79 is the number that matters for Spot Silver right now. The Iran ceasefire is dead, the Strait is getting worse, and every dollar crude adds from here feeds the inflation repricing that crushed the post-payrolls longs on Wednesday. A pullback in oil gives silver room to breathe but the June FOMC minutes already told traders the committee is closer to hiking than cutting. That does not expire with one quiet day in the Persian Gulf.
The $59.44 to $58.53 retracement zone is where the bulls either prove they have real money or give it up. Hold it and $63.28 comes back into play. Lose it and the next stop is $55.60.
More Information in our Economic Calendar.


