


Correction Extends After June Top-and-Drop Setup
In the June 12 update, when the S&P 500 (SPX) was trading at around $7,422, I showed, using the Elliott Wave Principle, that a bounce to $7,440-7,525 followed by a decline to $6,840-7,075 was expected.
Fast-forward to today: the index peaked on June 15 at $7,577, fell to $7,294 on June 26, rallied to $7,551 on July 6, and is now trading around $7,475. Thus, while we got the “top and drop” correct, the index failed to reach the downside target and tagged on another complex leg. See Figure 1 below.
Figure 1. Short-term Elliott Wave count with technical indicators for the SP500
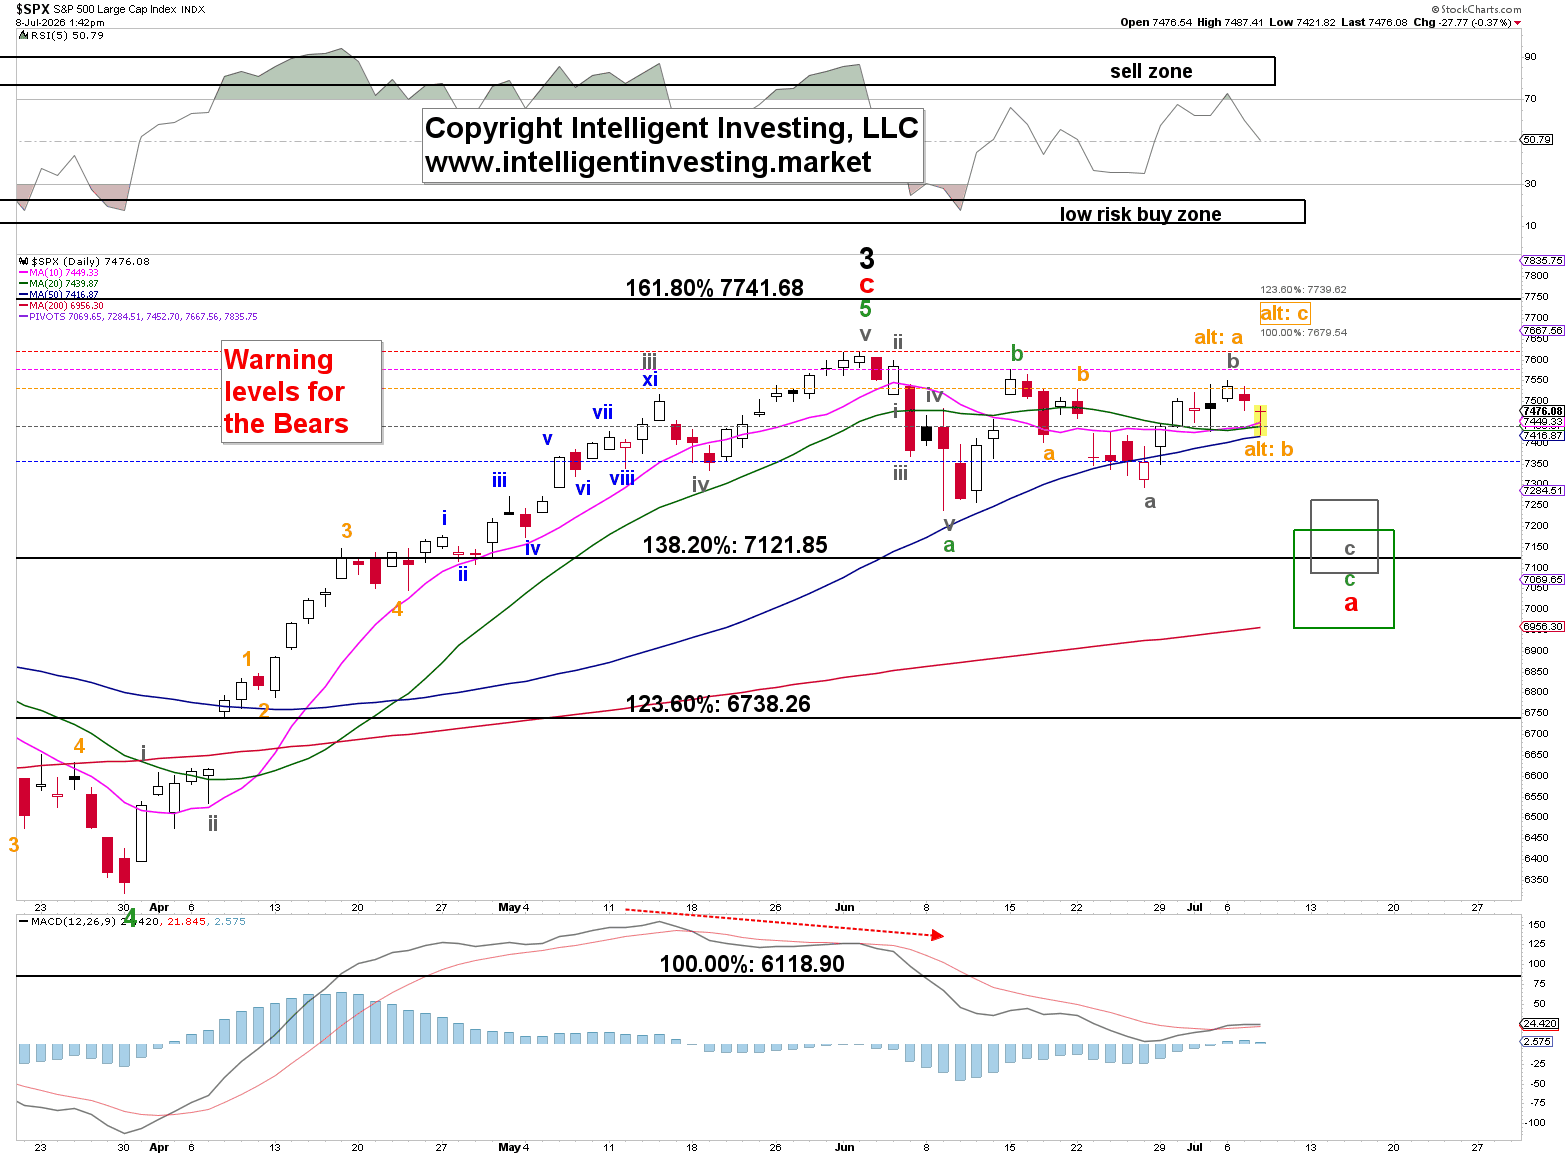
Given that the index hasn’t moved much since May 14, when it traded at levels like today’s, our assumption that a larger correction is underway remains correct: a 4th wave. Since 4th waves are often complex, with many unexpected twists and turns, and primarily comprise three-legged moves (abc-abc-abc), it is no surprise that we experienced the June 26-July 6 rally.

Key Breakout Levels Define the Next Move
The question now is whether we can see a more immediate downside move into the gray and green target zones, with confluence around the black 138.20% Fibonacci level ($7,121), which is the extension of the 2020-2021 rally measured from the 2022 low. The same applies to the black 100.00%, 123.6%, and 161.8% extensions. Alternatively, we may see a continuation of the rally that started on June 26, with an ideal target of $7,679-$7,739, which is very close to the 161.80% Fibonacci extension at $7,741.
Namely, when a third wave, in this case black W-3, doesn’t reach its full potential, often the 161.80% extension of W-1 measured from W-2 (see above), then the B-wave of the 4th wave often does the trick. And clearly the market has that potential with picture-perfect confluence: orange W-c = 1.236x orange W-a, measured from today’s low (orange W-b) at $7,739 vs. $7,741.
When do we know the index has set its sights on this number? First, a break above the July 6 high at $7,551 is needed, followed by a break above the $7,721 all-time high set on June 2. However, if we see a break below today’s low, followed by a break below the June 28 low at $7,348, the index will target ~$7,140 +/- $50 before it can try for $7,740 again.
S&P 500 Price Forecast
Every new S&P 500 analysis as it publishes, today's technical signal and key levels, live price — on one page.
See all S&P 500 forecastsThus, although we would have preferred a clearer picture, financial markets are at times simply less certain. Recognizing this is not washing one’s hands of innocence but rather the value of professional experience. Thus, we must play the cards we’ve been dealt, and fortunately, we have clear price levels that indicate the next directional move and the targets to expect.


