Bullish Pennant Forms Near Trend Highs
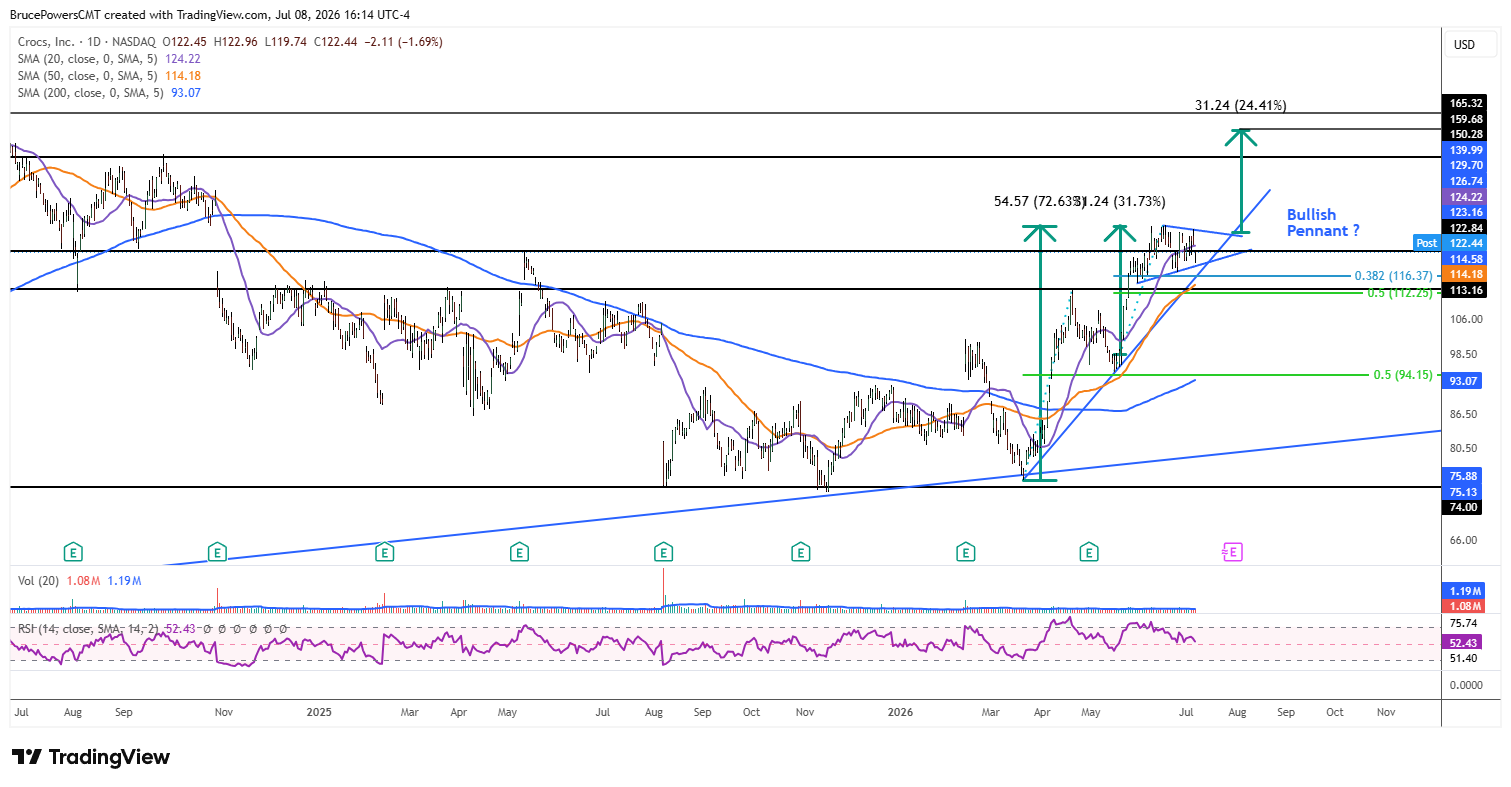
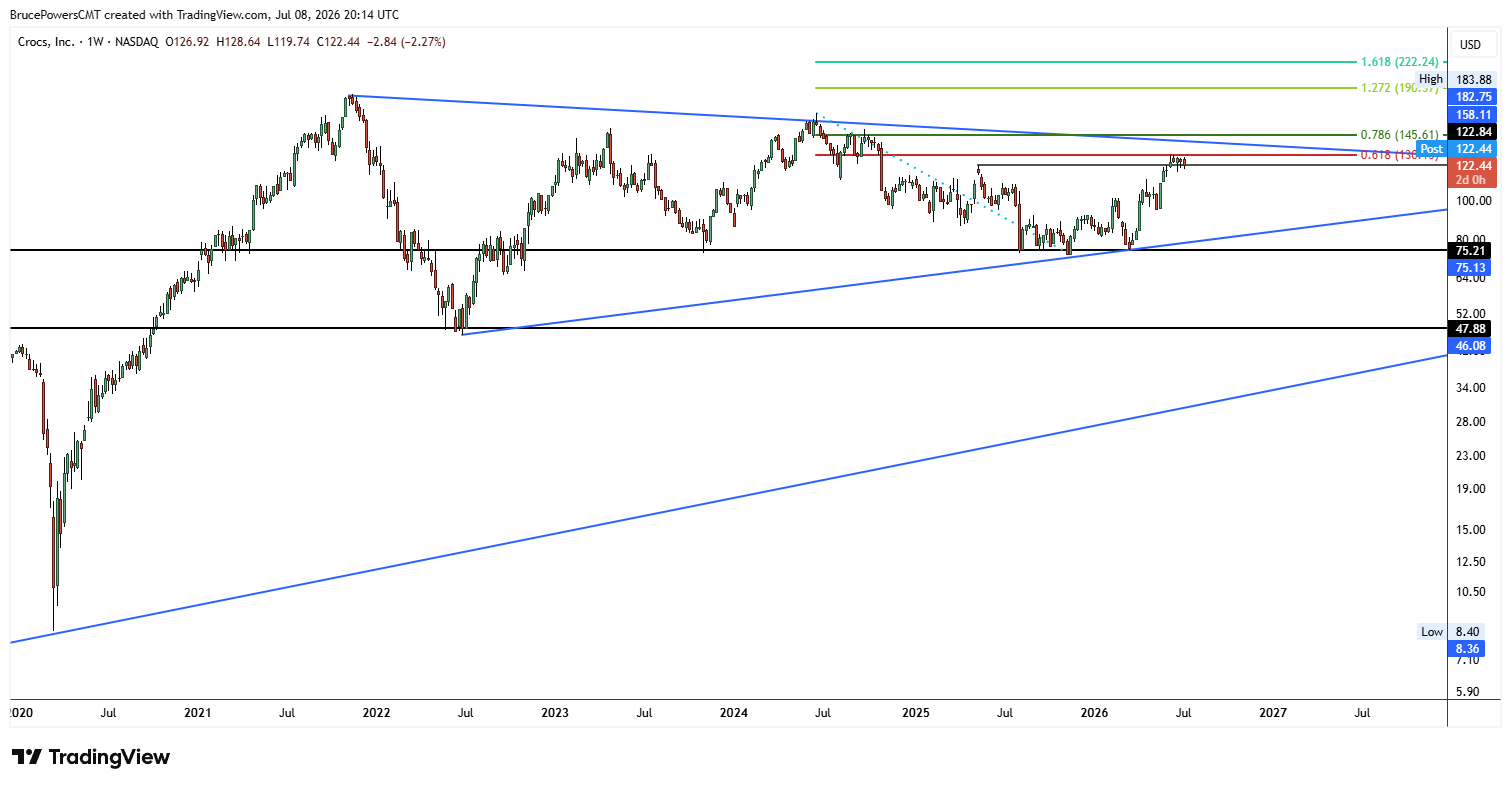
Crocs, Inc. (CROX) stock has been forming a potential bullish pennant pattern, as it has been consolidating near recent trend highs. A higher swing low of $75.13 was established in March, and the low was followed by an approximate 72.6% advance to the recent high of $129.70. The pennant may have further to develop before a breakout is ready, but the top and bottom boundary lines are already defined on the chart.

Support Structure Reinforces Bullish Setup
During the recent advance, the prior high of $113.16 was exceeded and it is now a key potential support zone, along with the rising 50-day moving average near $114.17. The fact that the pennant consolidation formation is occurring above those key support indicators is a sign of continued strength following the recent advance.
The bearish correction from the June high retraced to a low of $117.49, almost reaching the 38.2% Fibonacci level of $116.37. If that minimum Fibonacci retracement level is maintained, it would be a sign of relative strength when compared to the retracement of the prior upswing, which completed an approximate 50% retracement. This shows improving underlying demand, since buyers did not wait for a deeper pullback before stepping in.
Breakout Trigger Comes into Focus
If the pennant is to retain its integrity, signs of support followed by renewed buying pressure should be seen once the lower boundary of the formation is tested. It looks like that could happen soon, since CROX fell to an eight-day low of $119.74, showing short-term weakness within the developing consolidation pattern. Given its current configuration, an upside breakout would trigger above the lower swing high of $128.64 from Tuesday.
Measured Move Points Toward Higher Target
Based on a sharp approximately 32% rise that preceded the pennant consolidation, which identifies the pole portion of the pattern, a successful breakout of the pattern suggests an estimated target of at least $159.68. The pole measurement begins from the momentum breakout that followed the May swing low. Although that target only uses a measured move from the pennant formation, it also aligns near a significant lower swing high of $165.32.
Pattern Support Defines Risk
In addition to the support levels mentioned above, the higher swing low of $117.49 helps define pennant support. If it is broken to the downside, the pennant pattern is invalidated. Therefore, the reaction near the lower boundary will be important, as a successful defense would reinforce the bullish continuation setup while a breakdown would signal that the consolidation pattern has failed.
If you’d like to know more about technical analysis and how traders use it, please visit our educational area.