
Precious Metals Fundamentals Supported by Central Bank Demand and Supply Limits
Gold and silver are underpinned on a structural basis as of July 9 by a continuation of central-bank accumulation as well as continued lackluster growth in primary mining supply. This trend has persisted over recent weeks and has also provided a solid basis for the gold and silver market that has operated independently of investment demand in recent times.
Primary production growth has been lackluster for both gold and silver as of July 9 and remains so. In addition, gold and silver recycling continues to play a role in the supply side.
Silver continues to stand out in terms of a continuation of growth in industrial fabrication, including applications in solar energy and electronics as well as electric vehicles. Investment demand also plays a role.
The broader gold and silver supply and demand outlook as of July 9 continues to be based on the continuation of central bank buying as well as the ongoing lackluster production growth for gold and silver. Also important for the supply and demand outlook for silver is the continuation of growth in industrial demand. And as always, a number of other key factors also contribute to the market dynamics.

Gold Spot Holds $4,075 – Symmetrical Triangle Breakout on 2h
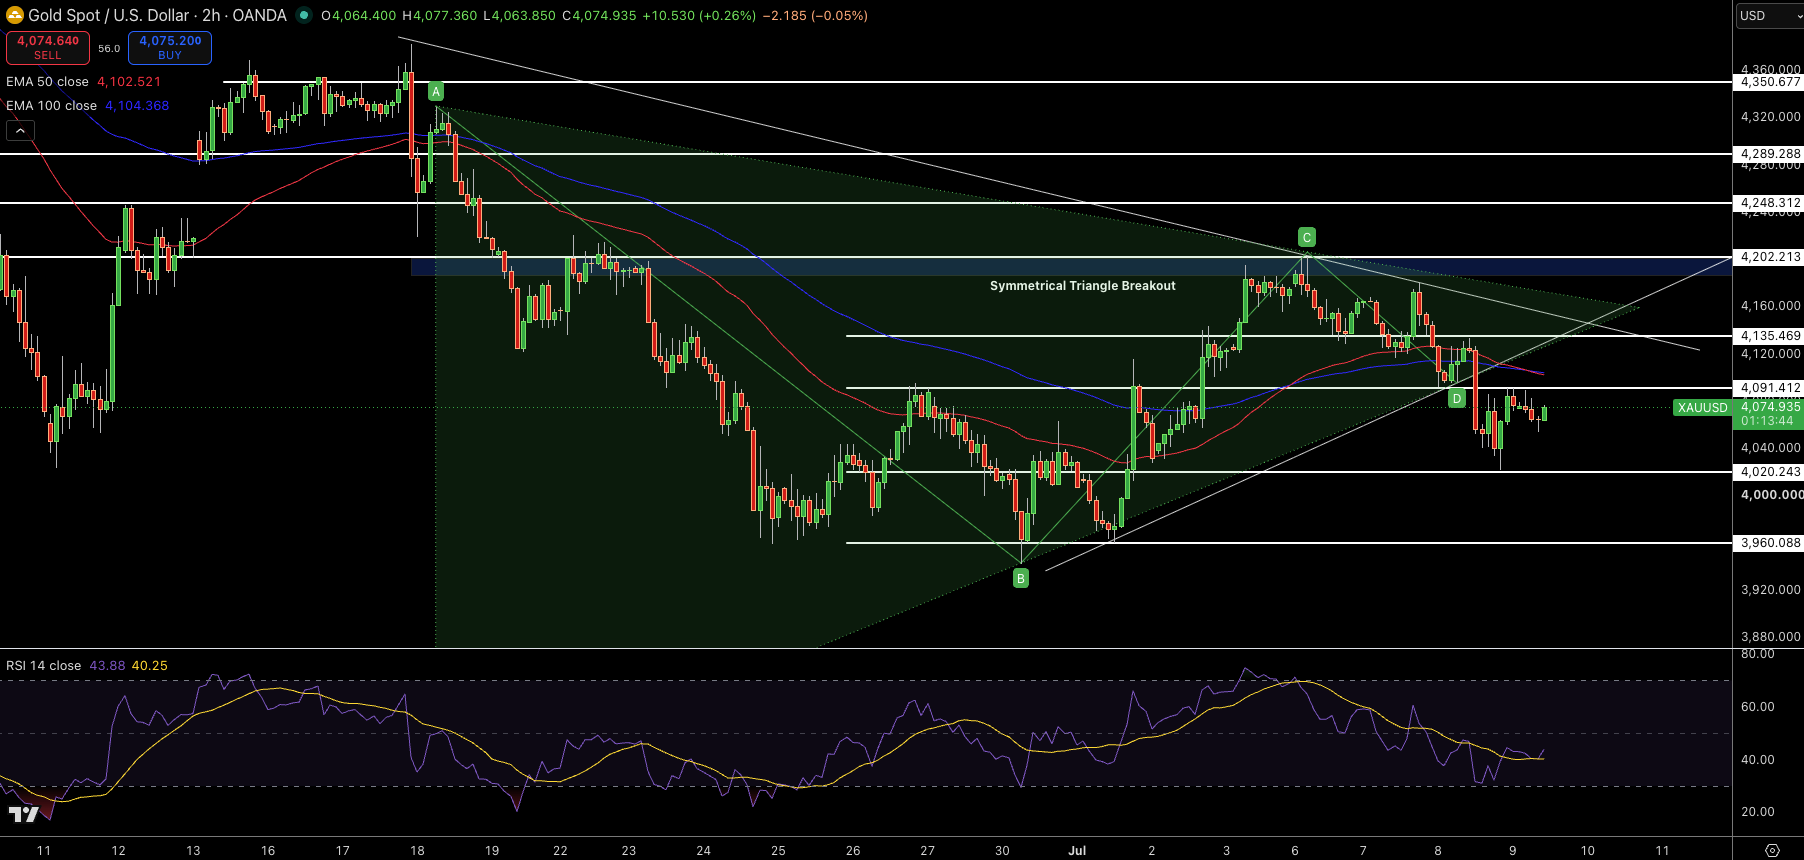
Gold Spot is currently positioned at $4,075 on the 2H chart. Following a defensive move off the triple bottom support near $3,959, a mixed group of green and red candles pushed to the edge of the symmetrical triangle resistance near $4,091. Bullish wicks combined with higher lows indicate demand is holding support. RSI remains around 44, showing a neutral bias.
Volume profile shows a strong accumulation region from $4,000 through $4,091. The 50 EMA (50-period Exponential Moving Average) sits just overhead near $4,103. Chart structure continues neutral-to-bullish on the breakout attempt from the symmetrical triangle at $4,091 in the down channel context from the $4,597 highs. Fibonacci confluence supports a short term bottom formation as a higher lows set up continues to develop.
Trade Idea: Buy $4,075 for $4,140, stop $4,091.
Gold Price Forecast
Every new Gold analysis as it publishes, today's technical signal and key levels, live price — on one page.
See all Gold forecastsSilver Spot Holds $58.27 – Fibonacci 0.236 Defense on 2h
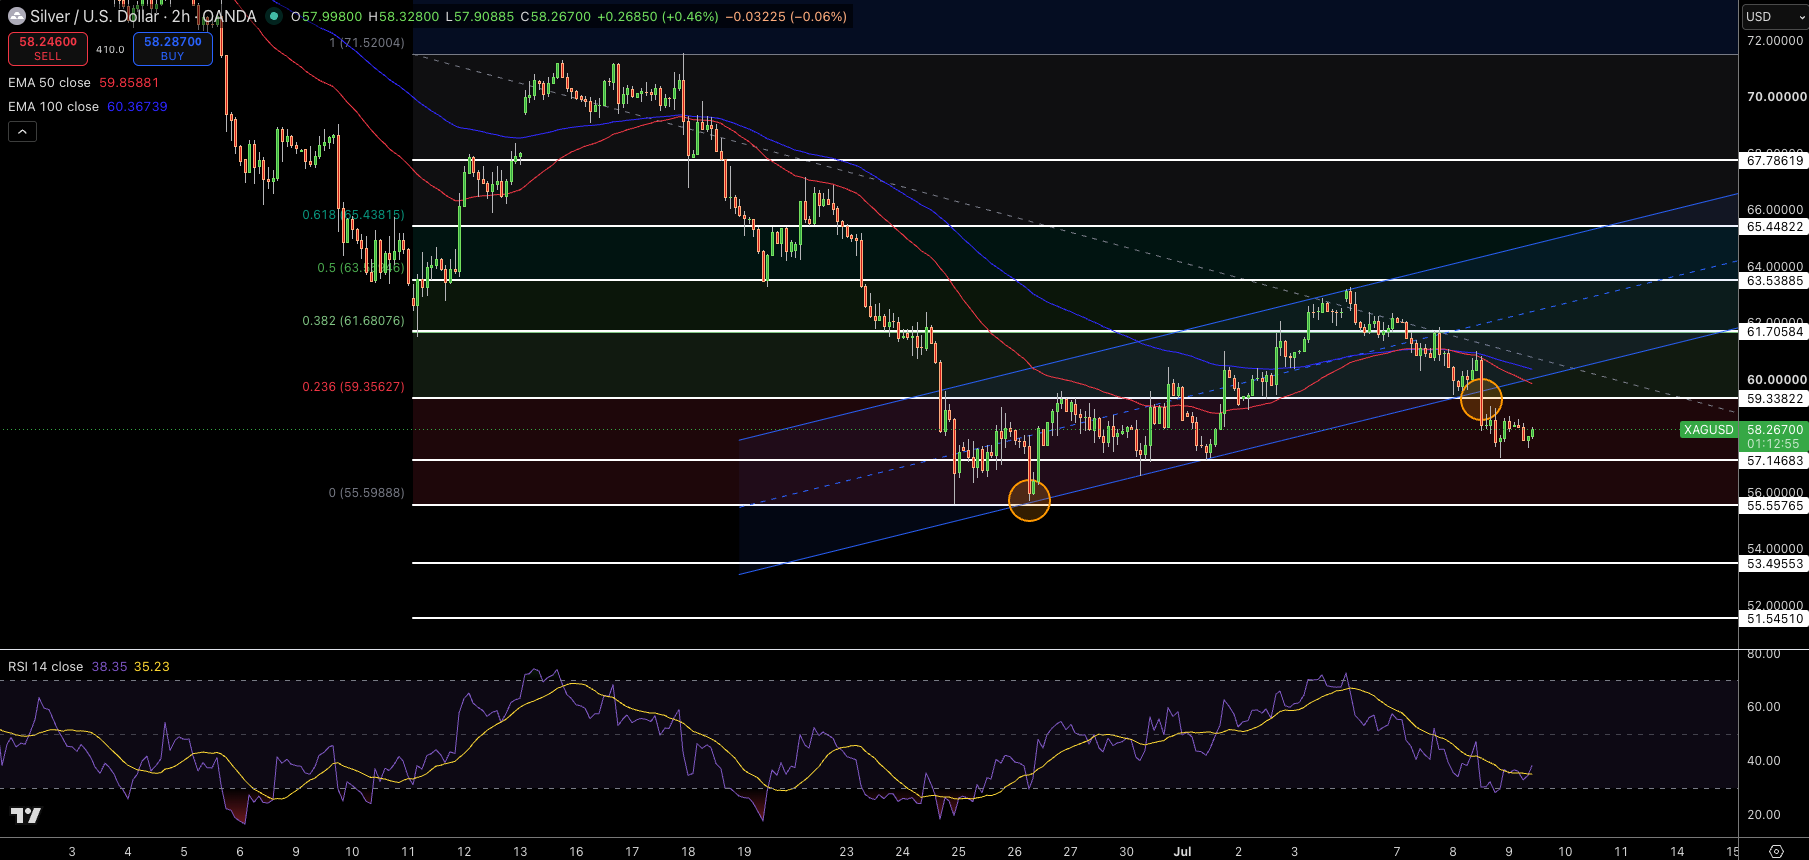
Silver is currently positioned at $58.27 on the 2H chart. A mixed group of green and red candles came close to testing the 0.236 Fibonacci level near $59.36 after falling from the $69.85 high. Bearish candles with lower highs show distribution as price holds support. RSI sits around 38, showing neutral-to-bearish momentum.
Volume profile points to strong support from $57 up to $59. The red MA (Moving Average) at $62.81 sits just overhead. Chart structure is neutral-to-bearish below $61.71 in the downtrend. Rejection wicks point to persistent sellers in the $62.50 area.
Trade Idea: Sell $58.27 for $55.60, stop $59.36.