



Oil prices rallied after President Donald Trump declared that the interim deal with Iran was over. The market reacted quickly as traders were expecting more oil to come from the Gulf. But these comments shifted the market sentiment and initiated a rally in oil prices. Brent oil reached the $79 a barrel and the sharp increase indicates that the oil is a big threat to global markets.
The initial shock was on assets that are sensitive to inflation. As oil climbed, bonds and gold (XAU) were in trouble. An increase in oil prices can lead to an increase in fuel prices, transportation costs and business costs. This can make it more difficult to manage inflation. It can also force central banks to remain cautious for longer.

WTI Oil Price Forecast: $80 Breakout Opens Path to $100
The 4-hour chart for WTI oil shows a rebound from $68. The chart below shows a strong resistance around the $79-$80 area. This resistance is stretched from the May 2026 highs at the red-dotted descending trendline.
A break above $80 will likely push WTI crude oil back towards the $89 area. But a break above $89 will likely push WTI crude oil back towards the $100 region.
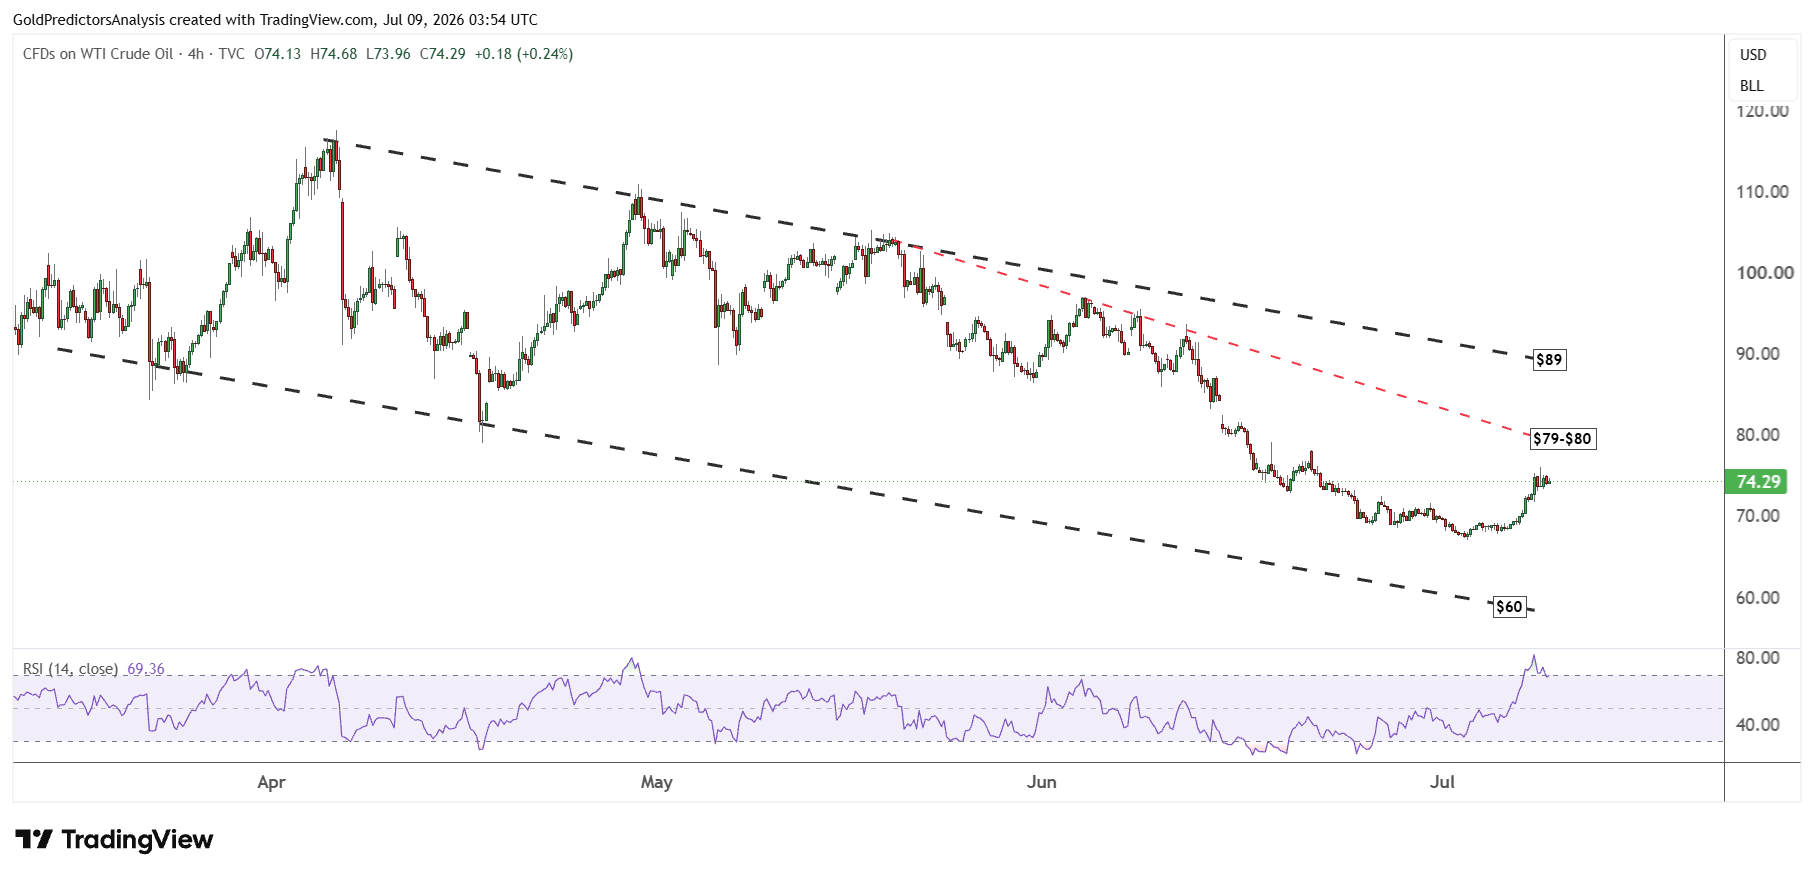
WTI crude oil is still trading within the descending trendline, and the rebound was expected as per the discussion in our previous analysis. The extremely overbought levels seen on the 4-hour chart suggest that the price may consolidate before the next move towards $80.
The weekly chart for WTI crude oil also shows that a rebound has developed from the strong support of the $69 area. The immediate resistance remains between the $78-$80 region. But a break above $80 will likely push WTI crude oil back to the $100 region. This rebound was driven by strong support of $69.
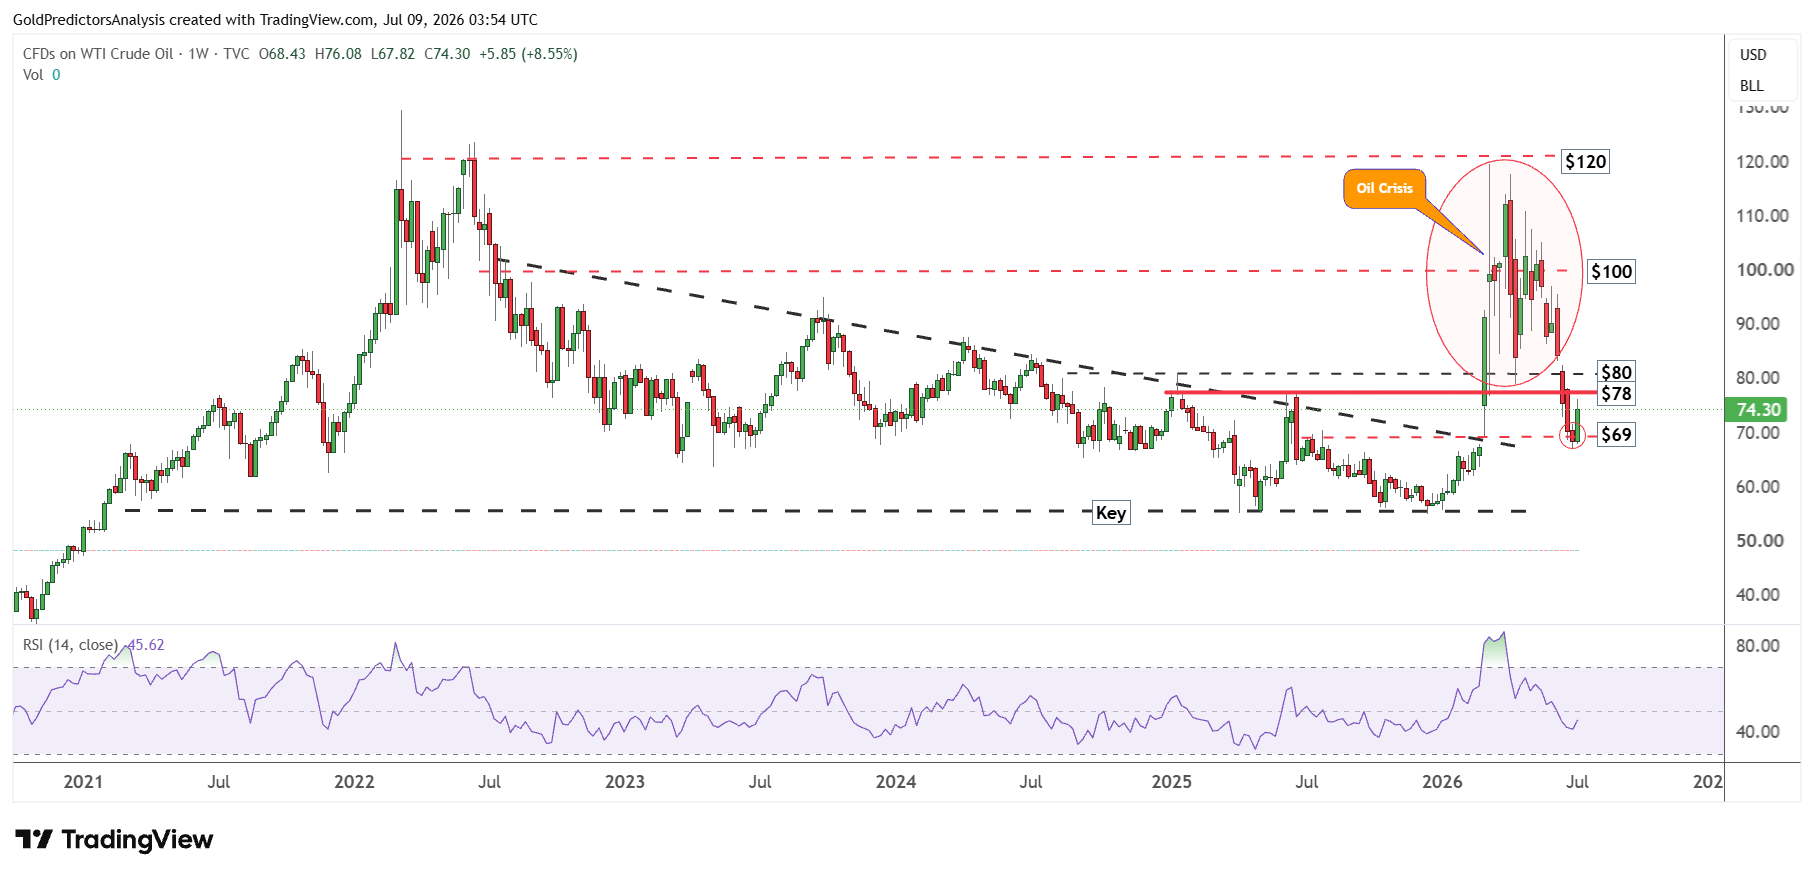
Oil prices are showing strong volatility and uncertainty since Iran war. The next move in oil prices will be driven by headlines rather than real concerns.
Brent Oil Price Forecast
Every new Brent Oil analysis as it publishes, today's technical signal and key levels, live price — on one page.
See all Brent Oil forecastsBrent Oil Price Forecast: $81 Breakout Opens Path to $90
The daily chart for Brent crude oil also shows the importance of the $72 to $74 region where the rebound was triggered to push prices towards $81. Now, the price is hovering around the resistance of $81. This resistance is defined by the blue dotted trendline extending from the June 2025 highs.
A break above $80 to $81 will likely push Brent crude oil towards the 200-day SMA at $83. However, a break above $83 will push prices back towards the $90 area. As long as Brent crude oil remains below $90, the uncertainty in Brent remains high.
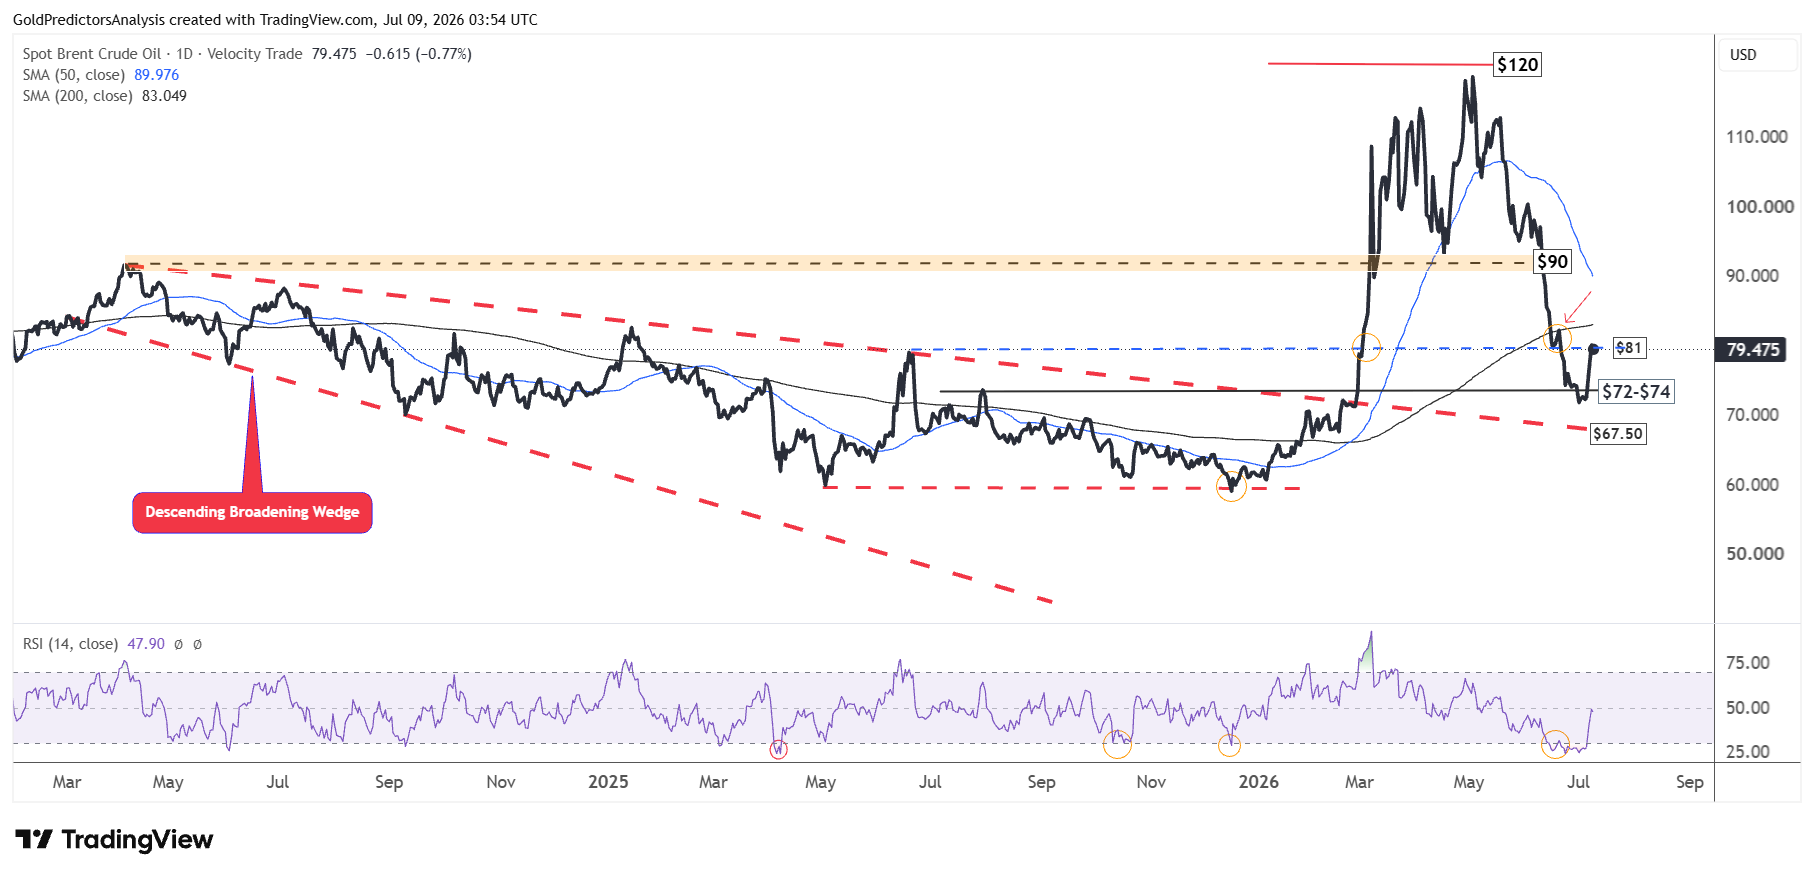
Prices may consolidate well between the $90 and $70 region and remain uncertain in the short term.
The monthly chart for Brent crude oil shows that the rebound was triggered from the key level of $70 as discussed in the previous analysis. The RSI was consolidating around the mid-line when this rebound was developed. The immediate resistance remains at $80, but a break above this level will push Brent crude oil towards $95.
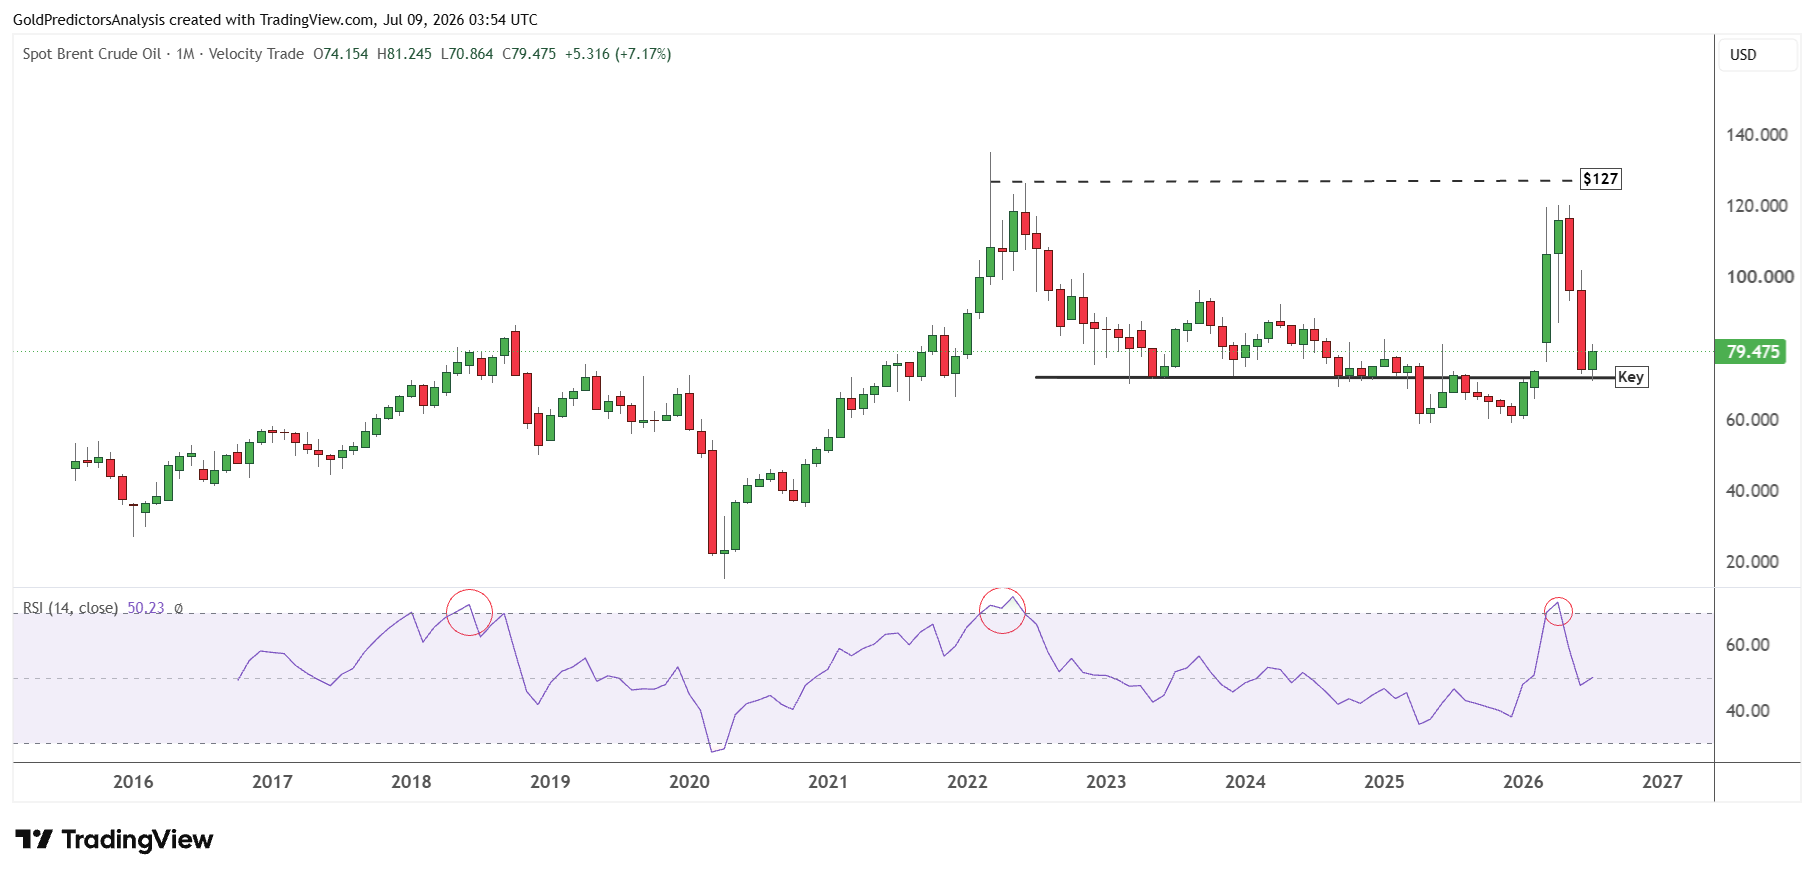
Brent crude oil prices may remain within the $70 and $120 range for the next few weeks as volatility in the oil market remains high due to the escalation in the conflict between US and Iran.
Bottom Line
The price of oil remains extremely sensitive to the headlines coming out of the Gulf. The end of the interim Iran deal has introduced the risk premium that has pushed the WTI and Brent oil towards the key resistance. A break above $80 in WTI would push the price to $89 and $100. On the other hand, a break above $81 in Brent oil would push price to $90 and $95. The market remains uncertain as long as the price remains below those key levels. The oil price may trend with headlines, shipping concerns and inflation fears rather than traditional supply and demand dynamics in the short term.
Read more: Supply Growth Limits WTI and Brent Rebound Outlook


