



Gold Bounces but Rate Risk Caps the Rally
Spot Gold picked up $31.07 on Thursday, trading at $4,108.18, up 0.76%, during the European session. The dollar backed off to around 100.98 on the Dollar Index and that was enough to get buyers interested after a rough stretch. The rally has a short leash, though. Wednesday’s FOMC minutes showed hawks in the room wanted to hike, and the 30-year is still above 5%.

Fed Minutes Put September in Play
Wednesday’s FOMC minutes showed several members pushing to hike before the committee voted to hold. That’s not a dovish hold.
“The higher-for-longer rate environment is detrimental for non-yielding assets like gold, which can lead to deeper declines,” said Nikos Tzabouras, senior market analyst at Tradu.com,
and that’s exactly the read coming out of those minutes.
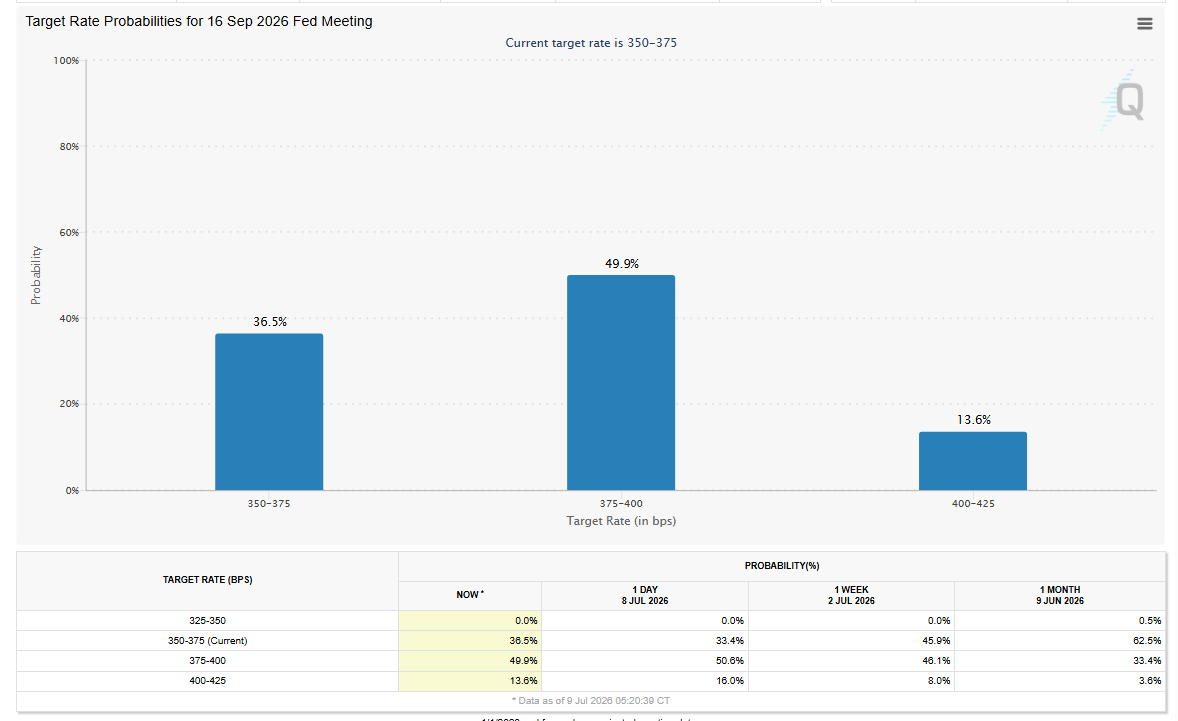
CME FedWatch jumped to 63% on a September rate increase. Next week’s CPI and Warsh’s congressional testimony are what move that number. If inflation comes in hot, September stops being a question.
Gold Price Forecast
Every new Gold analysis as it publishes, today's technical signal and key levels, live price — on one page.
See all Gold forecastsYields Are Doing the Damage
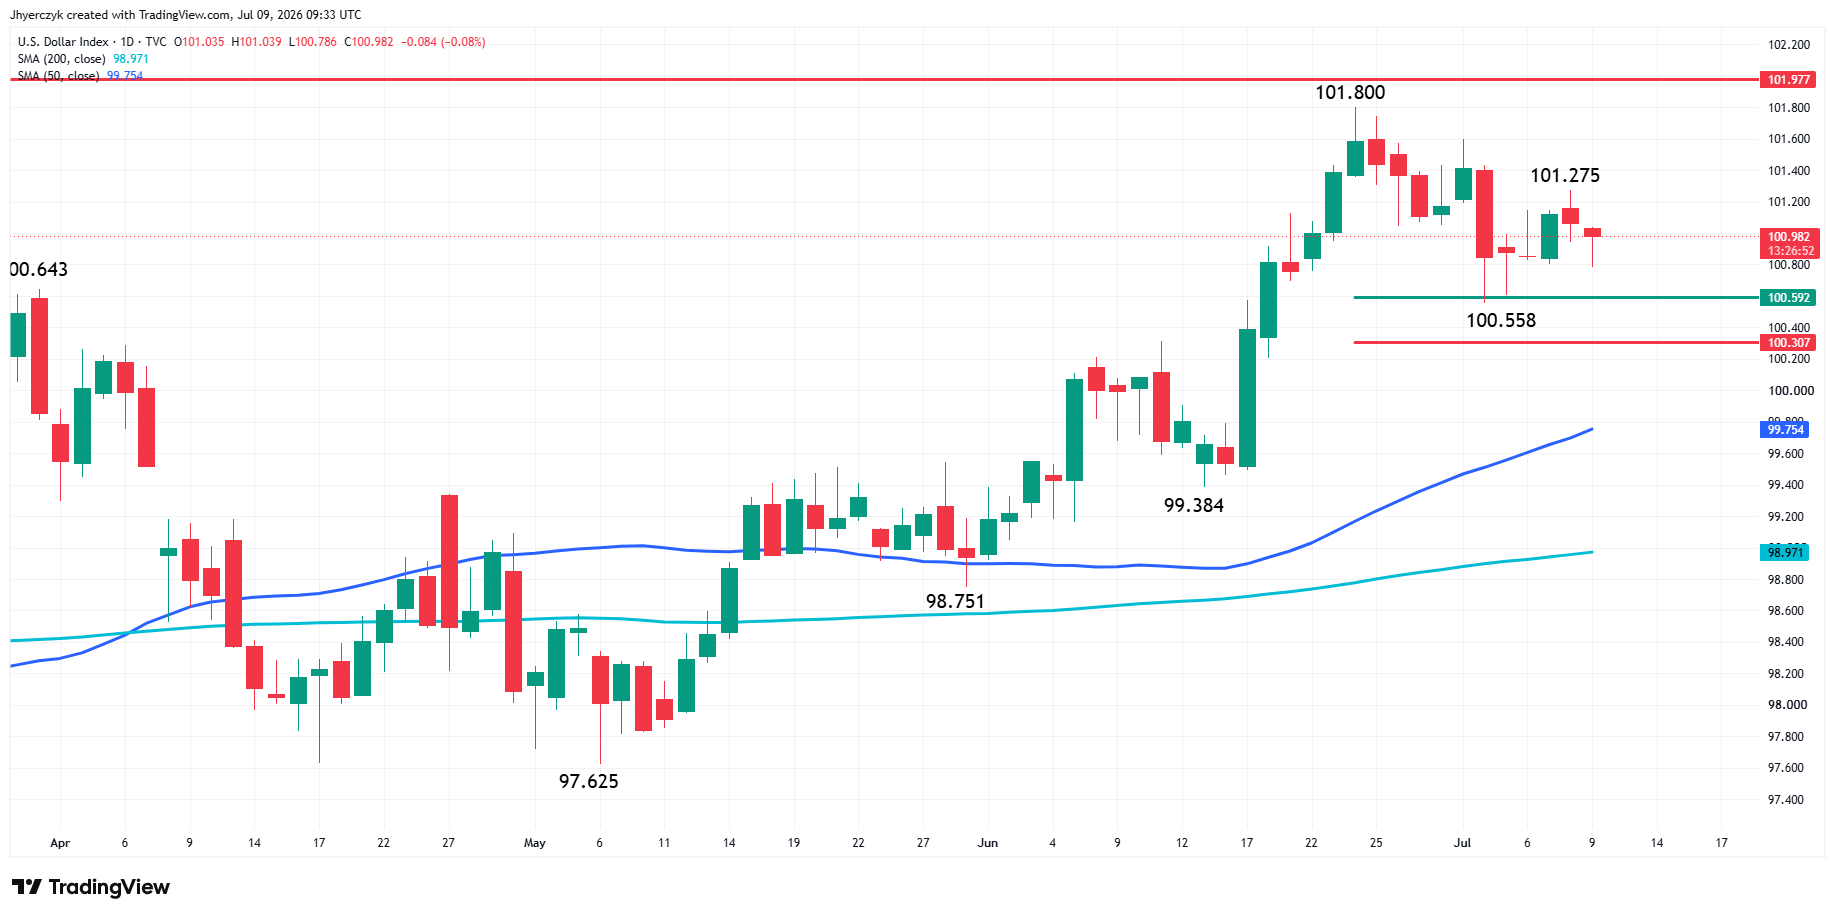
The dollar dipped to 100.98 on the Dollar Index Thursday and gold caught a bid, but that’s not a recovery. The 10-year jumped to 4.57%, the 2-year is at 4.20%, and the 30-year crossed 5%. “Gold is trying to form a bottom today as dollar strength eases,” said Nikos Tzabouras, senior market analyst at Tradu.com. One soft day in the greenback doesn’t cancel out what the bond market just did.
Fresh U.S. strikes on Iranian military targets drove crude higher earlier this week and that fed straight into rate expectations.
“A jump in oil prices could bring forward the timing of a Fed hike,” said Kyle Rodda, senior financial market analyst at Capital.com.
President Trump said Iran reached out seeking an agreement, which cooled the immediate panic, but yields didn’t come back down. The bond market already repriced and gold is stuck with the result.
HSBC Trimmed but Sees a Floor
HSBC cut its 2026 gold forecast to $4,560 from $4,864 and dropped the 2027 number to $4,925 from $5,000. The bank expects a $3,800 to $4,700 range for the rest of this year with gold finishing around $4,750. Their reasoning is straightforward: monetary policy repriced, the dollar repriced, and gold corrected from the January record high as a result.
Central bank buying slowed down and ETF money left in the first half. HSBC thinks both reverse later this year. Their bigger call is that the rate and dollar damage is already in the price, and that deficit spending and sovereign debt loads keep a floor under gold from here.
Daily Spot Gold (XAUUSD) Technical Analysis
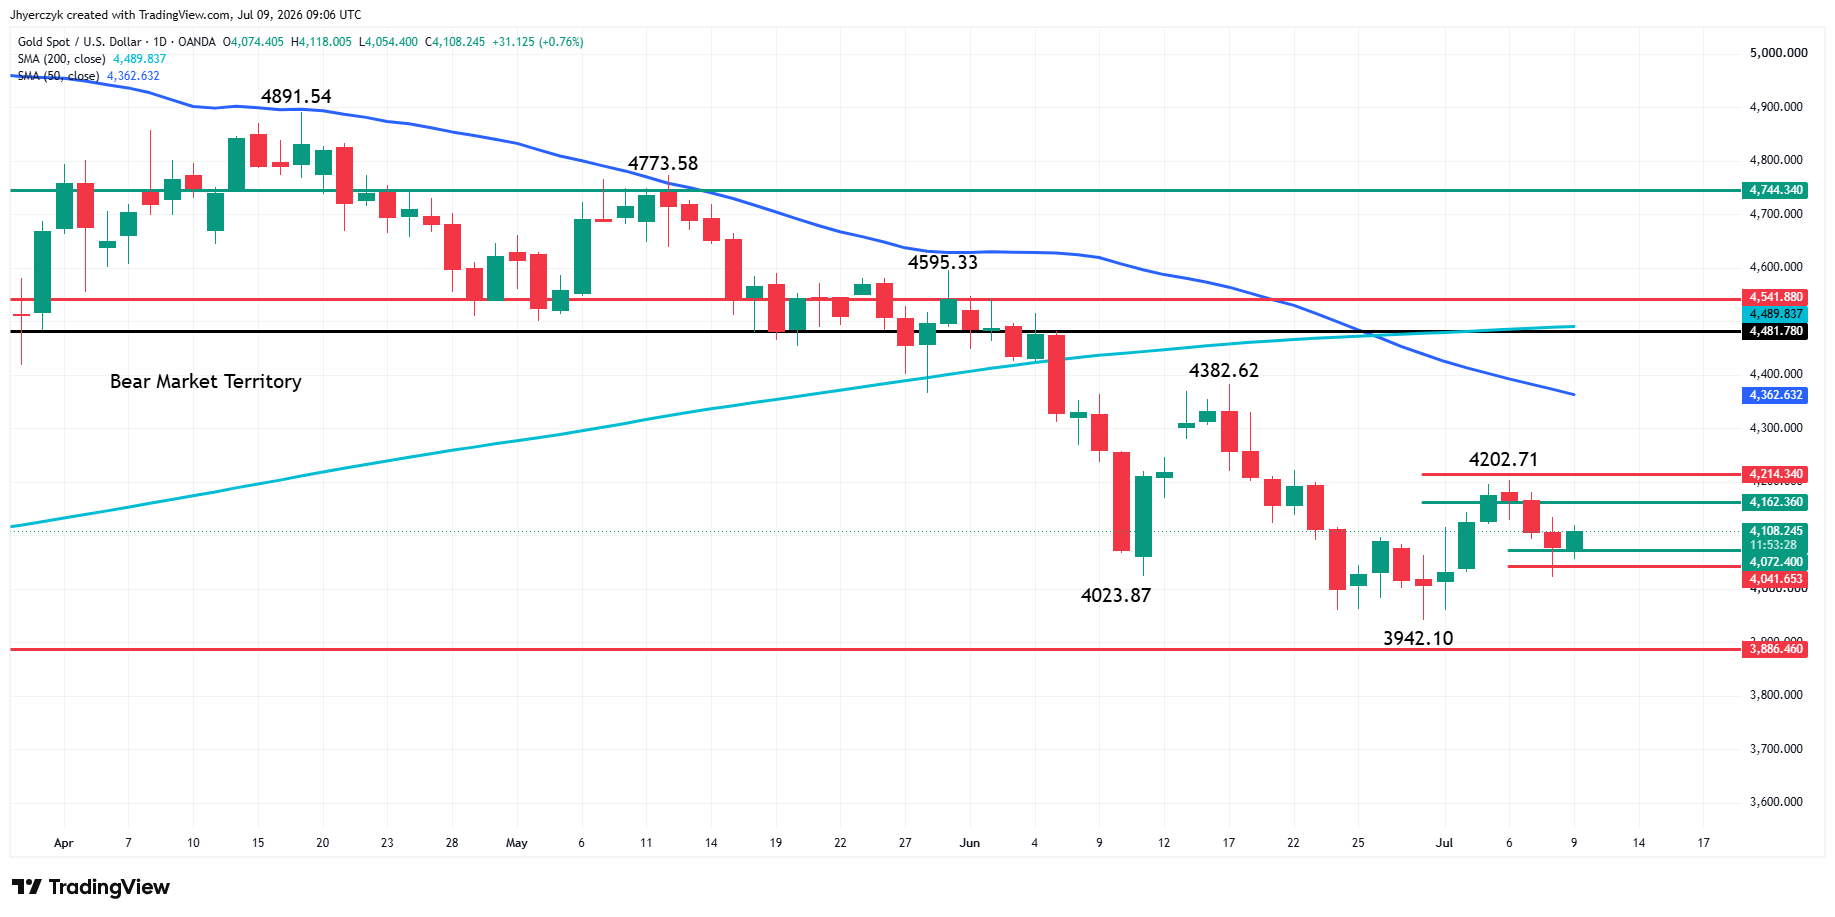
Spot Gold is holding steady early Thursday as traders assess the importance of a short-term retracement zone for a second session. Trader reaction to this zone should set the tone today and perhaps the near-term. This area is critical to the chart pattern because the formation of a secondary higher bottom could lead to a change and trend and a possible test of the 50-day moving average.
The main trend is down according to the swing chart and the moving averages. A trade through $4202.71 will change the main trend to up and could create the upside momentum needed to challenge the 50-day moving average at $4362.63. A move through the swing bottom at $3942.10 will reaffirm the downtrend. The longer-term main bottom at $3886.46 is not only support, but also a potential trigger point for an acceleration to the downside.
Two short-term ranges are currently controlling the price action.
The first range is $4382.62 to $3942.10. Its retracement zone at $4162.36 to $4214.34 stopped the rally at $4202.71 on July 6. The second range is $3942.10 to $4202.71. Its retracement zone $4072.40 to $4041.75 is currently being tested.
Trader reaction to $4072.40 to $4041.65 is the area to watch today.
Bullish traders are trying to establish a secondary higher bottom. A sustained move over $4072.40 will indicate the presence of buyers. Their job is to create the momentum needed to overcome $4202.71 and change the main trend to up.
Bearish traders are going to try to drive the market under $4041.65. This could be the catalyst that sets up a test of the support area at $3942.10 to $3886.46.
What to Watch
Next week is the whole trade for gold. CPI drops first and Warsh testifies after. The sequence matters. A cool inflation print takes September off the table before Warsh even sits down, and gold rallies on the repricing alone. A hot number does the opposite, and Warsh walks into Congress with no reason to push back on 63% hike odds. The bond market is already positioned for it with the 30-year above 5%.
Bulls need the $4,072 to $4,041 zone to hold. That’s the secondary higher bottom. Above $4,202 changes the trend. Below $4,041 and gold drops back to $3,942.
If you’d like to know more about how to trade gold, please visit our educational area.



