Cardano (ADA) has jumped by 10% in the past 7 days after bouncing strongly off the $0.14 level, and history shows that this could mark the beginning of the token’s recovery.
Last month, ADA broke a long-dated horizontal support at $0.24 and experienced a 42% loss in just 30 days as market conditions deteriorated.
The macroeconomic backdrop right now is unfavorable for cryptocurrencies with well-established use cases and ecosystems like Ethereum (ETH) and Solana (SOL), and even more so for projects like Cardano, which have struggled to prove that they can attract developers.
Even though ADA is one of the largest crypto tokens with a market cap of $6 billion, its blockchain has turned into what the community now calls a “zombie chain” as transaction volumes have dried up due to lower usage.
Cardano Meets the Criteria to Be Deemed a Zombie Chain
Data from DeFi Llama shows the impact of this bear market on Cardano. Last month, the number of transactions processed by the Cardano blockchain stood at around 800,000, meaning a 62% compared to the latest peak in December 2024.
Meanwhile, this figure translates into an even more dramatic 83% decline when compared to Cardano’s all-time high of 4.66 million transactions processed in November 2021.
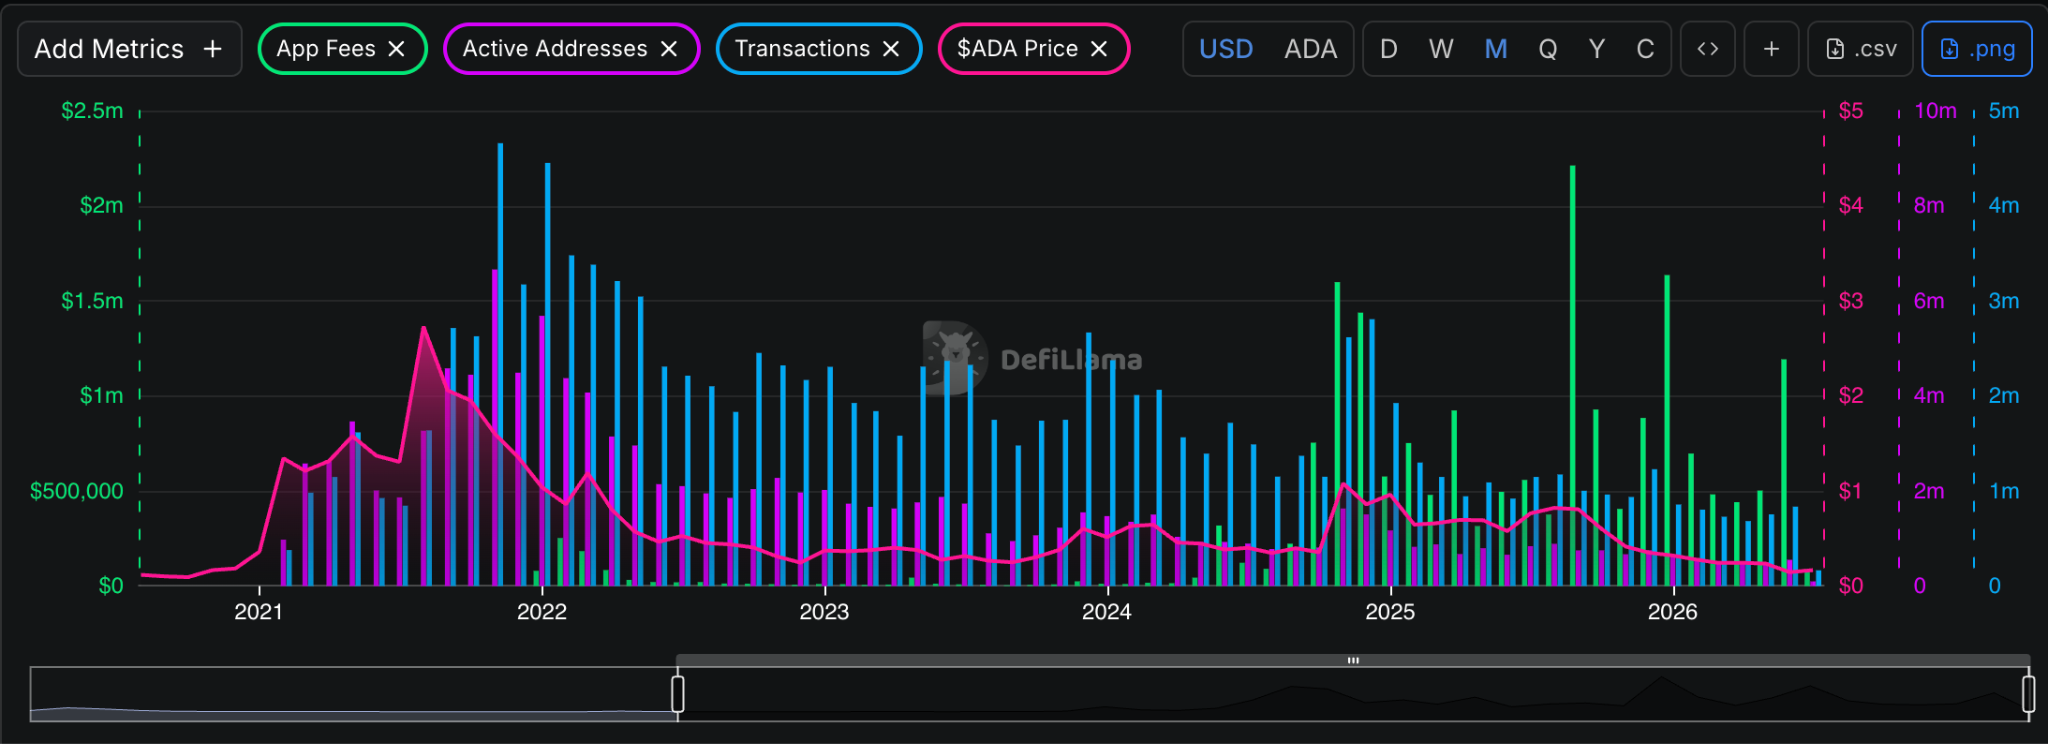
Similarly, monthly active users in June stood at 550,000, down 66% drop compared to that same December 2024 peak, and 92% below the metric’s November 2021 all-time high.
What this indicates is that ecosystem growth has stalled and users are no longer interested in what this blockchain has to offer, especially as Cardano failed to capitalize on top trends that strengthened some of its peers like stablecoins, DeFi, and meme coins.
The total value locked (TVL) of the Cardano blockchain currently stands at just $80 million compared to $38 billion for Ethereum and $4.9 billion for Solana.
Despite these heavily bearish on-chain metrics, a historical pattern seems to suggest that ADA could start to recover in the next few weeks.
This Needs to Happen for ADA to Rise to $1
Back in 2022, ADA plummeted to a cycle low of $0.24, which acted as strong support multiple times a few months later.
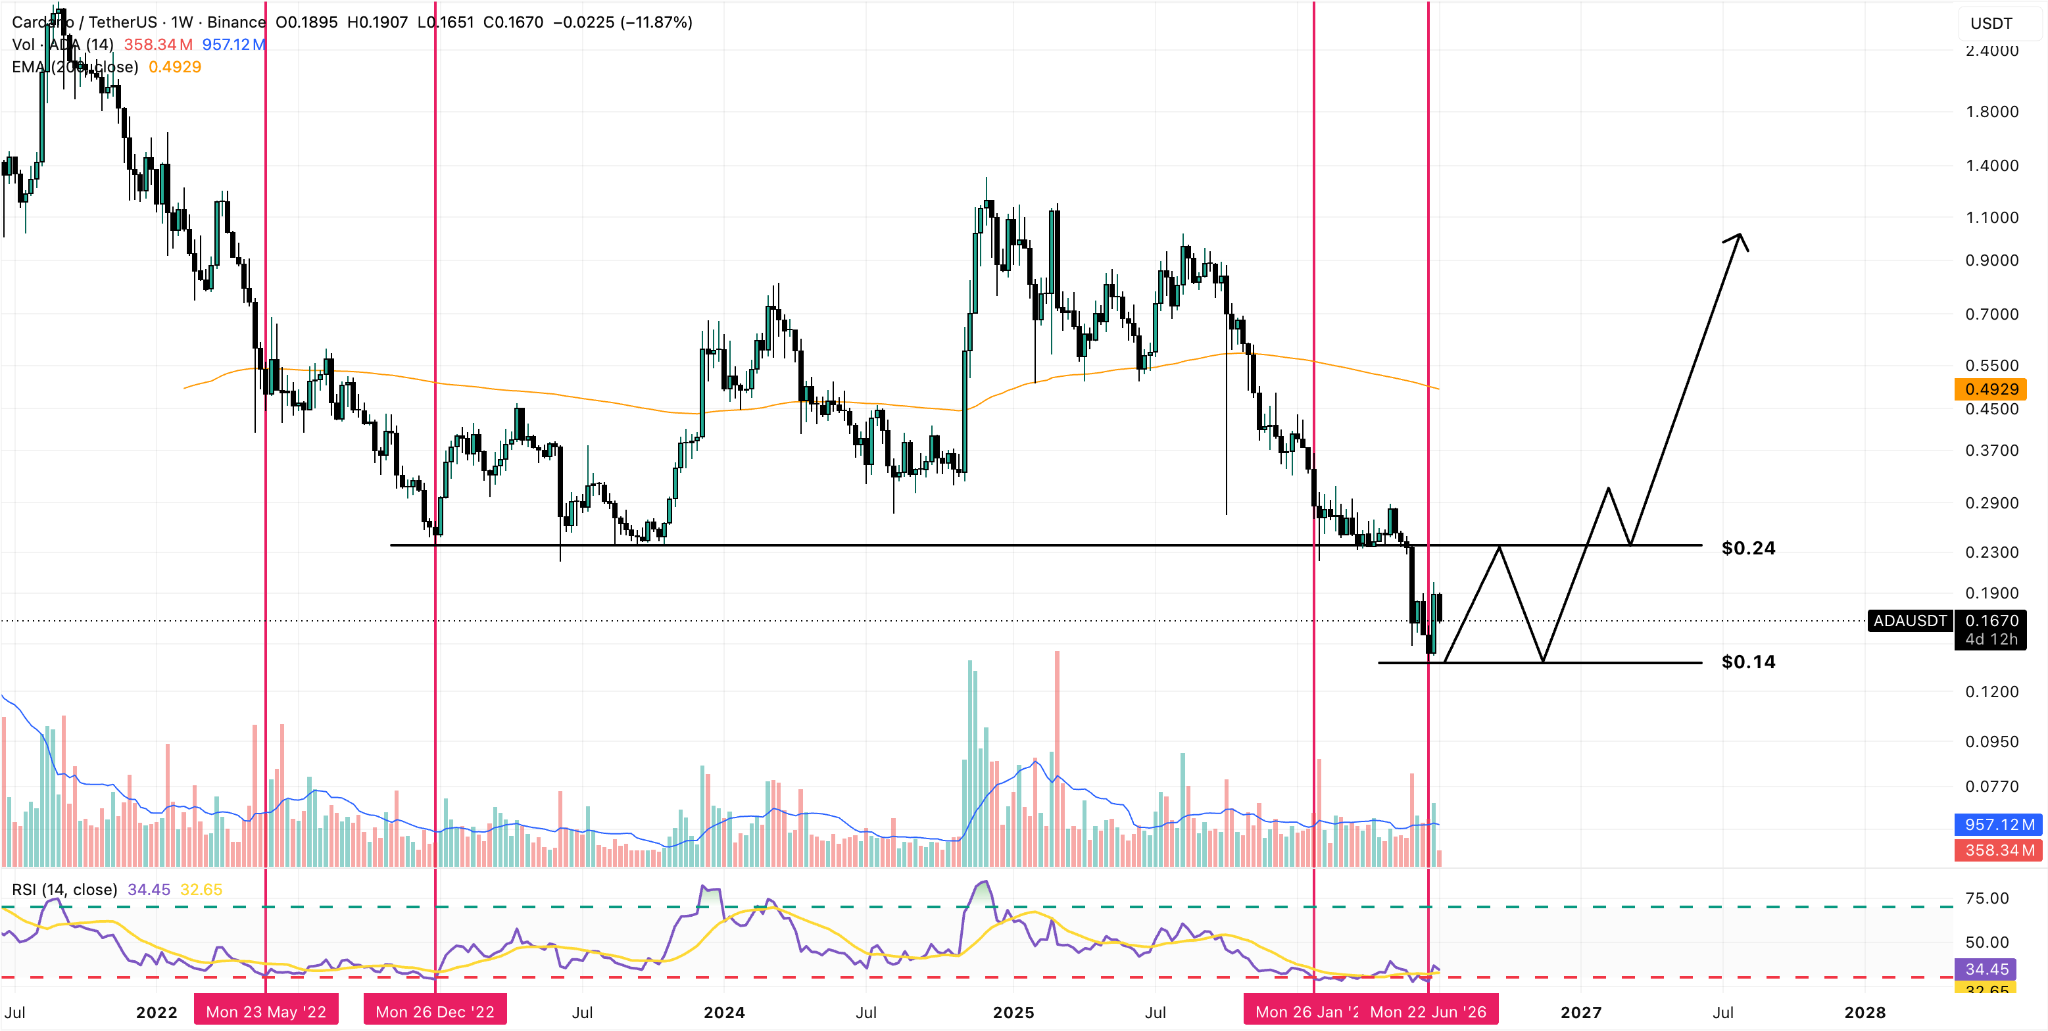
The downtrend started to decelerate after the weekly Relative Strength Index (RSI) first hit oversold territory. Then, a second big drop occurred, and the oscillator was pushed back to this threshold.
That second decline marked the end of that bear market, and ADA progressively recovered from $0.24 to $0.70 and then above $1.
A similar pattern has unfolded this time. The price just hit a first low at $0.24 during this bearish cycle at the time the RSI flashed oversold. Then, a break below this previous low occurred a month ago, and we hit a new low at $0.14.
Now, the RSI is back in oversold territory, but we got a strong bullish candle last week that could mark the beginning of a recovery for ADA.
We expect that the token will soon retest this former support area at $0.24 from below. If, and only if, the token breaks that mark, we could witness the beginning of ADA’s next leg up to $1, as a replay of the 2022 price action will likely take place.