Ethereum’s native token, Ether (ETH), fell more than 2.6% to around $1,725 on Wednesday, extending its pullback after a rejection from the upper boundary of a bearish “megaphone pattern.”

ETH Megaphone Breakdown Risks Dip Toward $1,600
A megaphone pattern forms when price prints higher highs and lower lows, creating two diverging trendlines. It reflects growing disagreement between bulls and bears, with each price swing becoming more aggressive as volatility expands.
Ether’s latest rejection from the pattern’s upper trendline near $1,800 suggests sellers are again taking control.
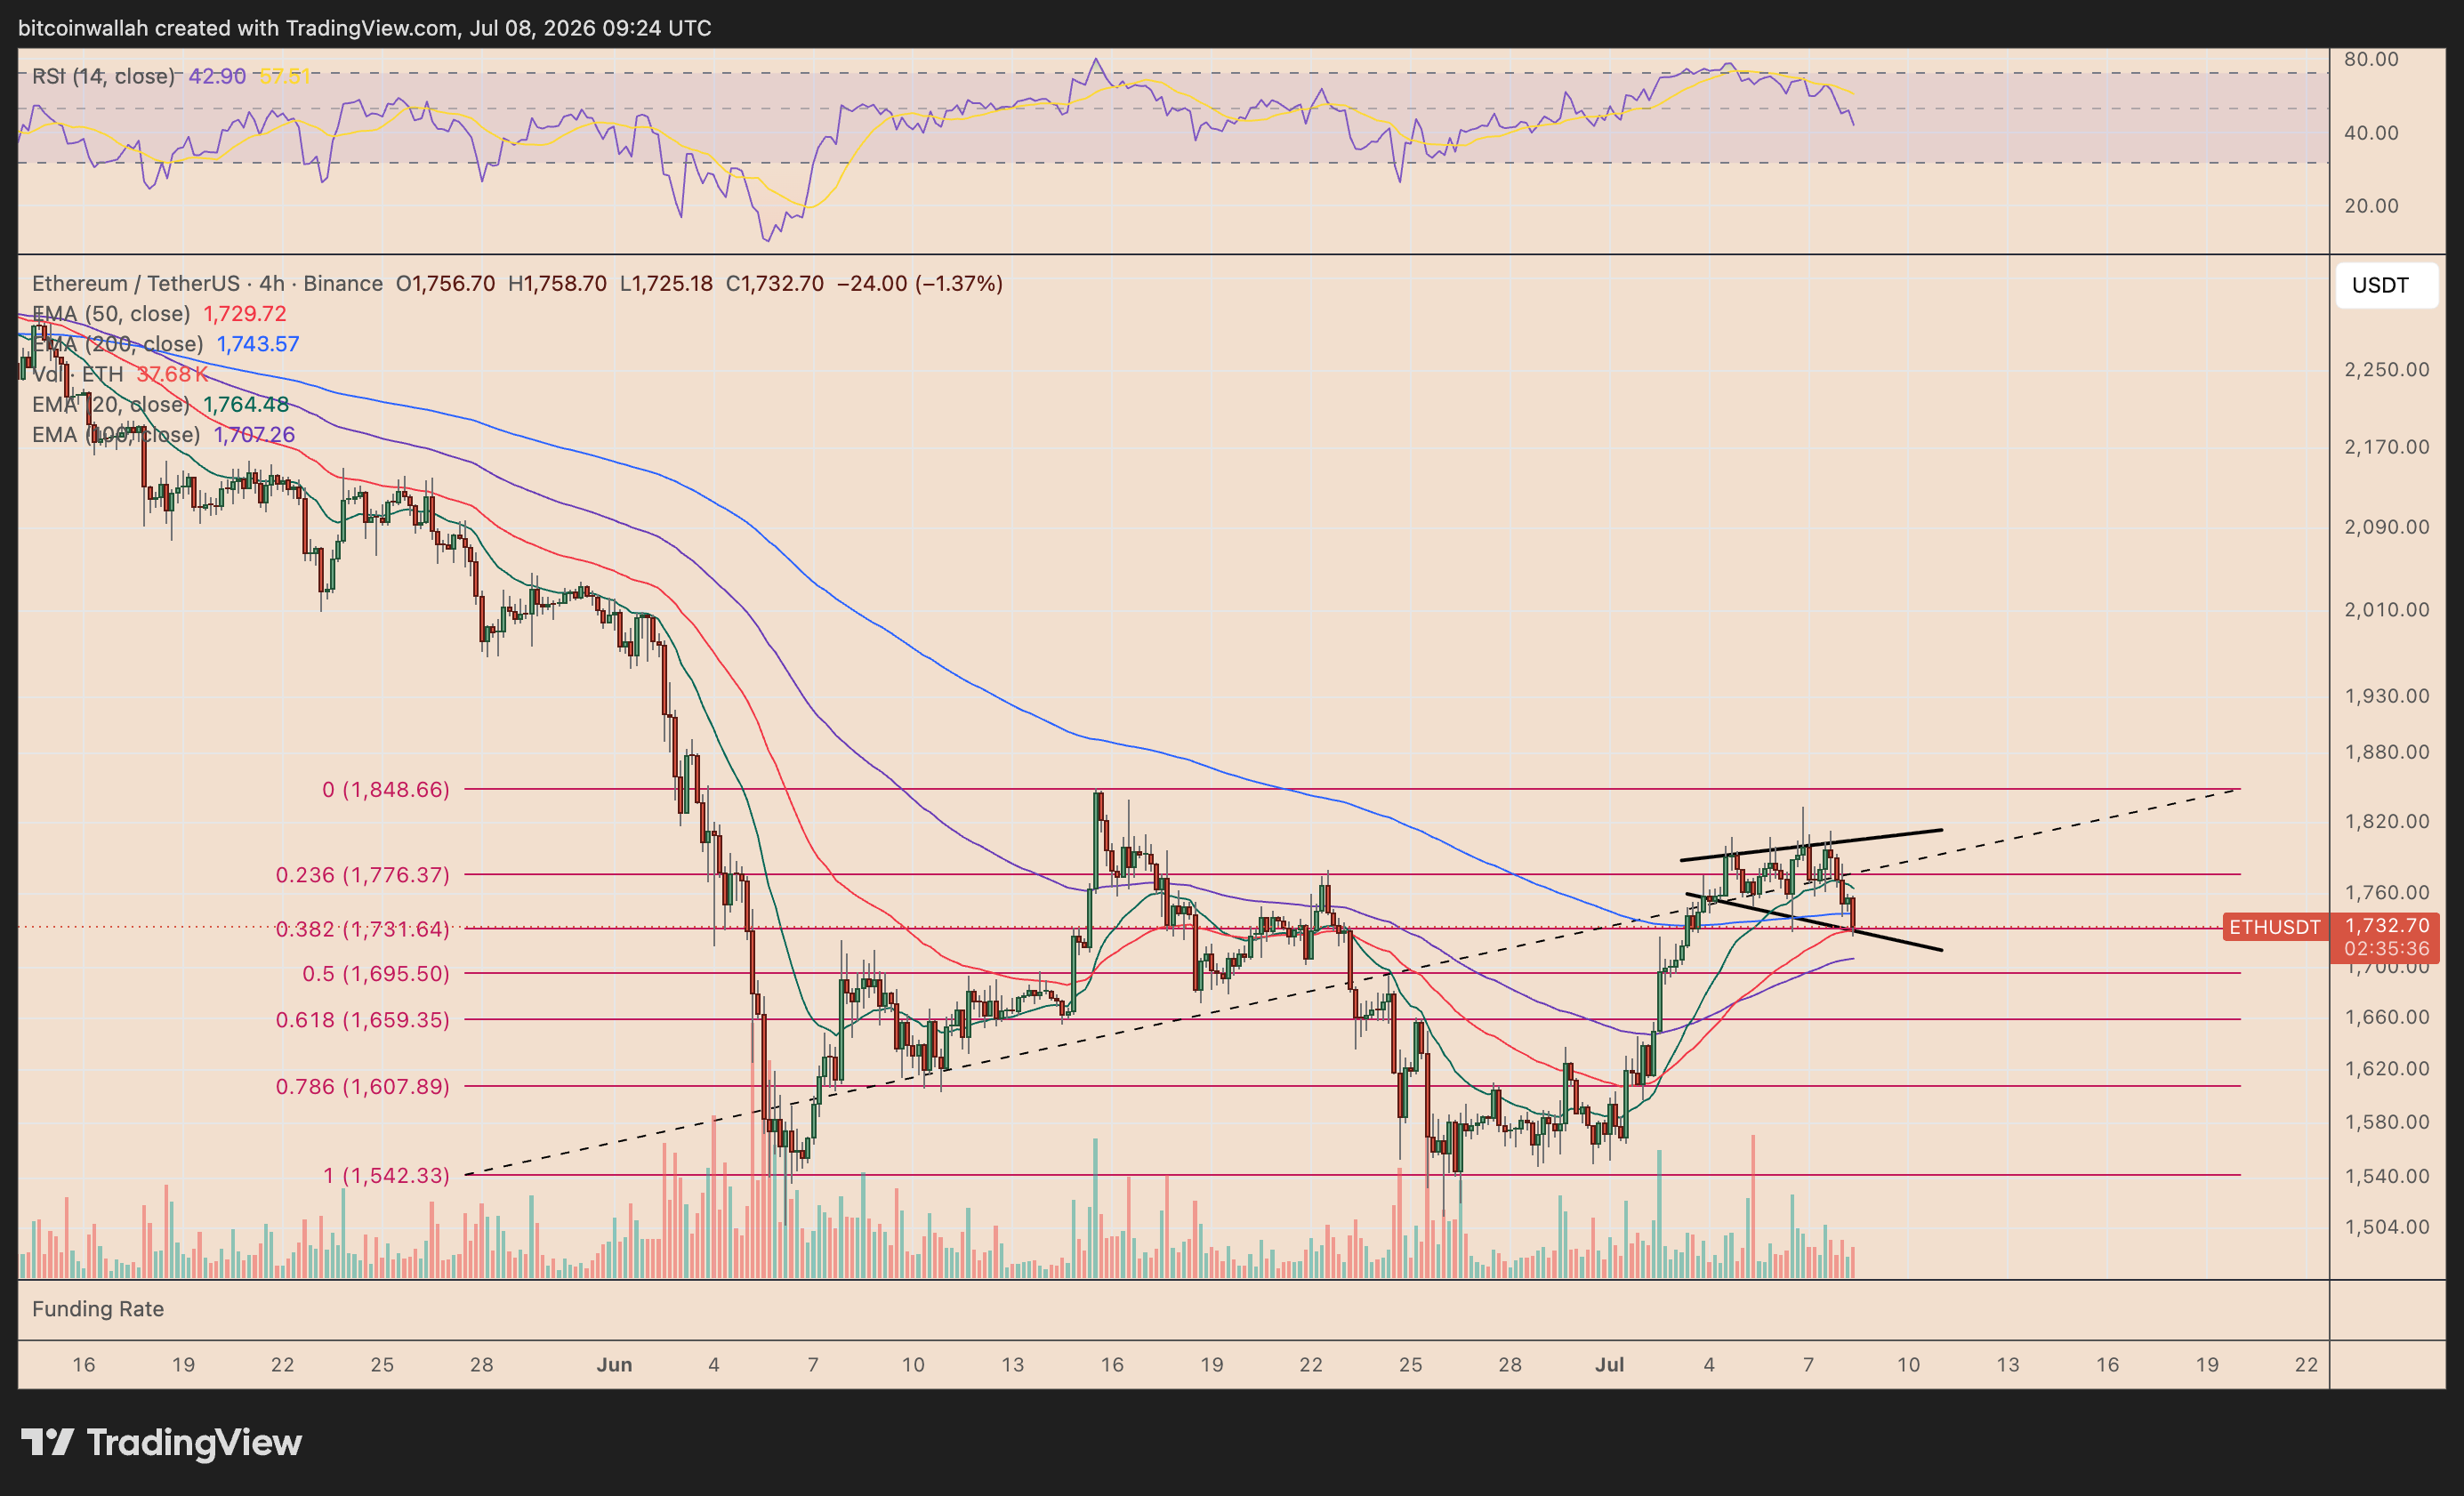
A decisive break below the lower trendline could confirm another bearish swing.
In that case, Ether could first test the $1,695 area, aligning with the 0.5 Fibonacci retracement level. A deeper selloff may push ETH toward $1,659 and eventually $1,608, corresponding with the 0.618 and 0.786 Fib levels, respectively.
The downside case is further supported by ETH’s relative strength index (RSI), which has fallen to around 43 from near-overbought levels, signaling weakening buying momentum.
Conversely, a rebound from the megaphone pattern’s lower trendline, if accompanied by rising volumes, could push the ETH price toward the upper boundary near the $1,800 level.
Ethereum Price Forecast
Every new Ethereum analysis as it publishes, today's technical signal and key levels, live price — on one page.
See all Ethereum forecastsRenewed US–Iran Tensions May Weigh on Ethereum
The bearish technical setup is emerging as renewed US-Iran hostilities pressure risk assets.
On Wednesday, the US launched a new round of strikes against more than 80 sites in Iran, while Tehran retaliated against US-linked military facilities in Bahrain and Kuwait, putting the fragile truce at risk.
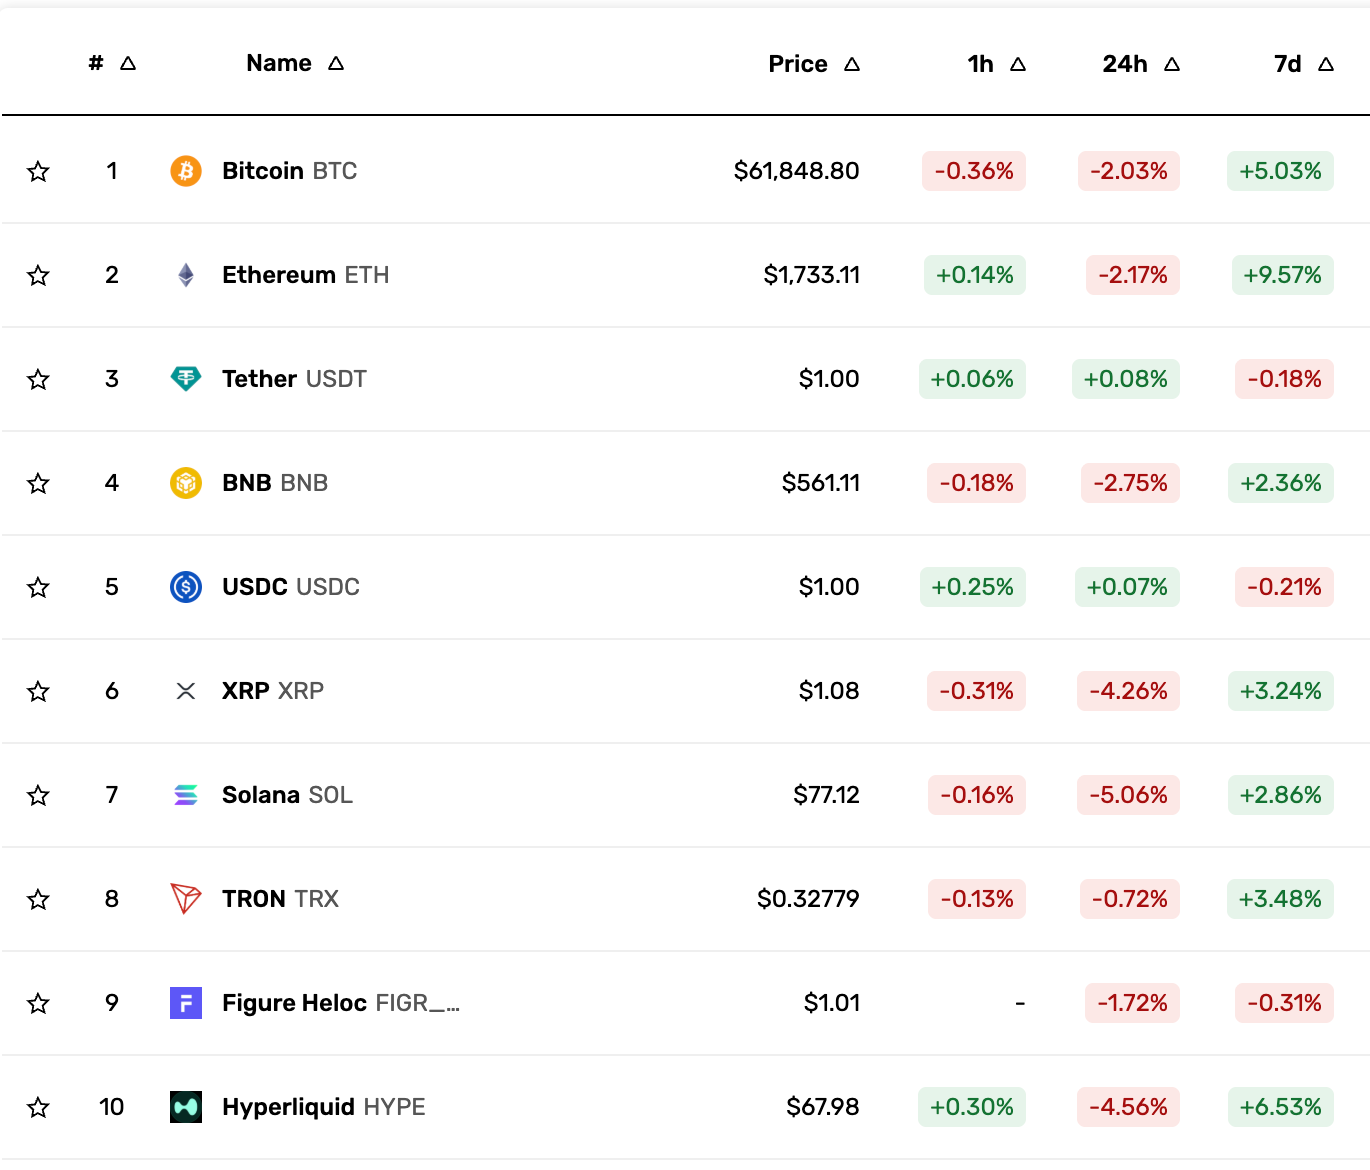
Oil prices jumped more than 5% as the escalation revived fears of supply disruptions through the Strait of Hormuz. The renewed geopolitical risk has also weighed on cryptocurrencies, as shown below.
Ethereum Whale Cost Basis Adds to Bearish Pressure
Ethereum’s on-chain structure also shows heavy resistance above the current price, with most whale cohorts now holding ETH below their average realized price.
The realized price of addresses holding 100-1,000 ETH (blue) sits at around $2,400, while the 1,000-10,000 ETH cohort (orange) is near $2,250, according to CryptoQuant data.
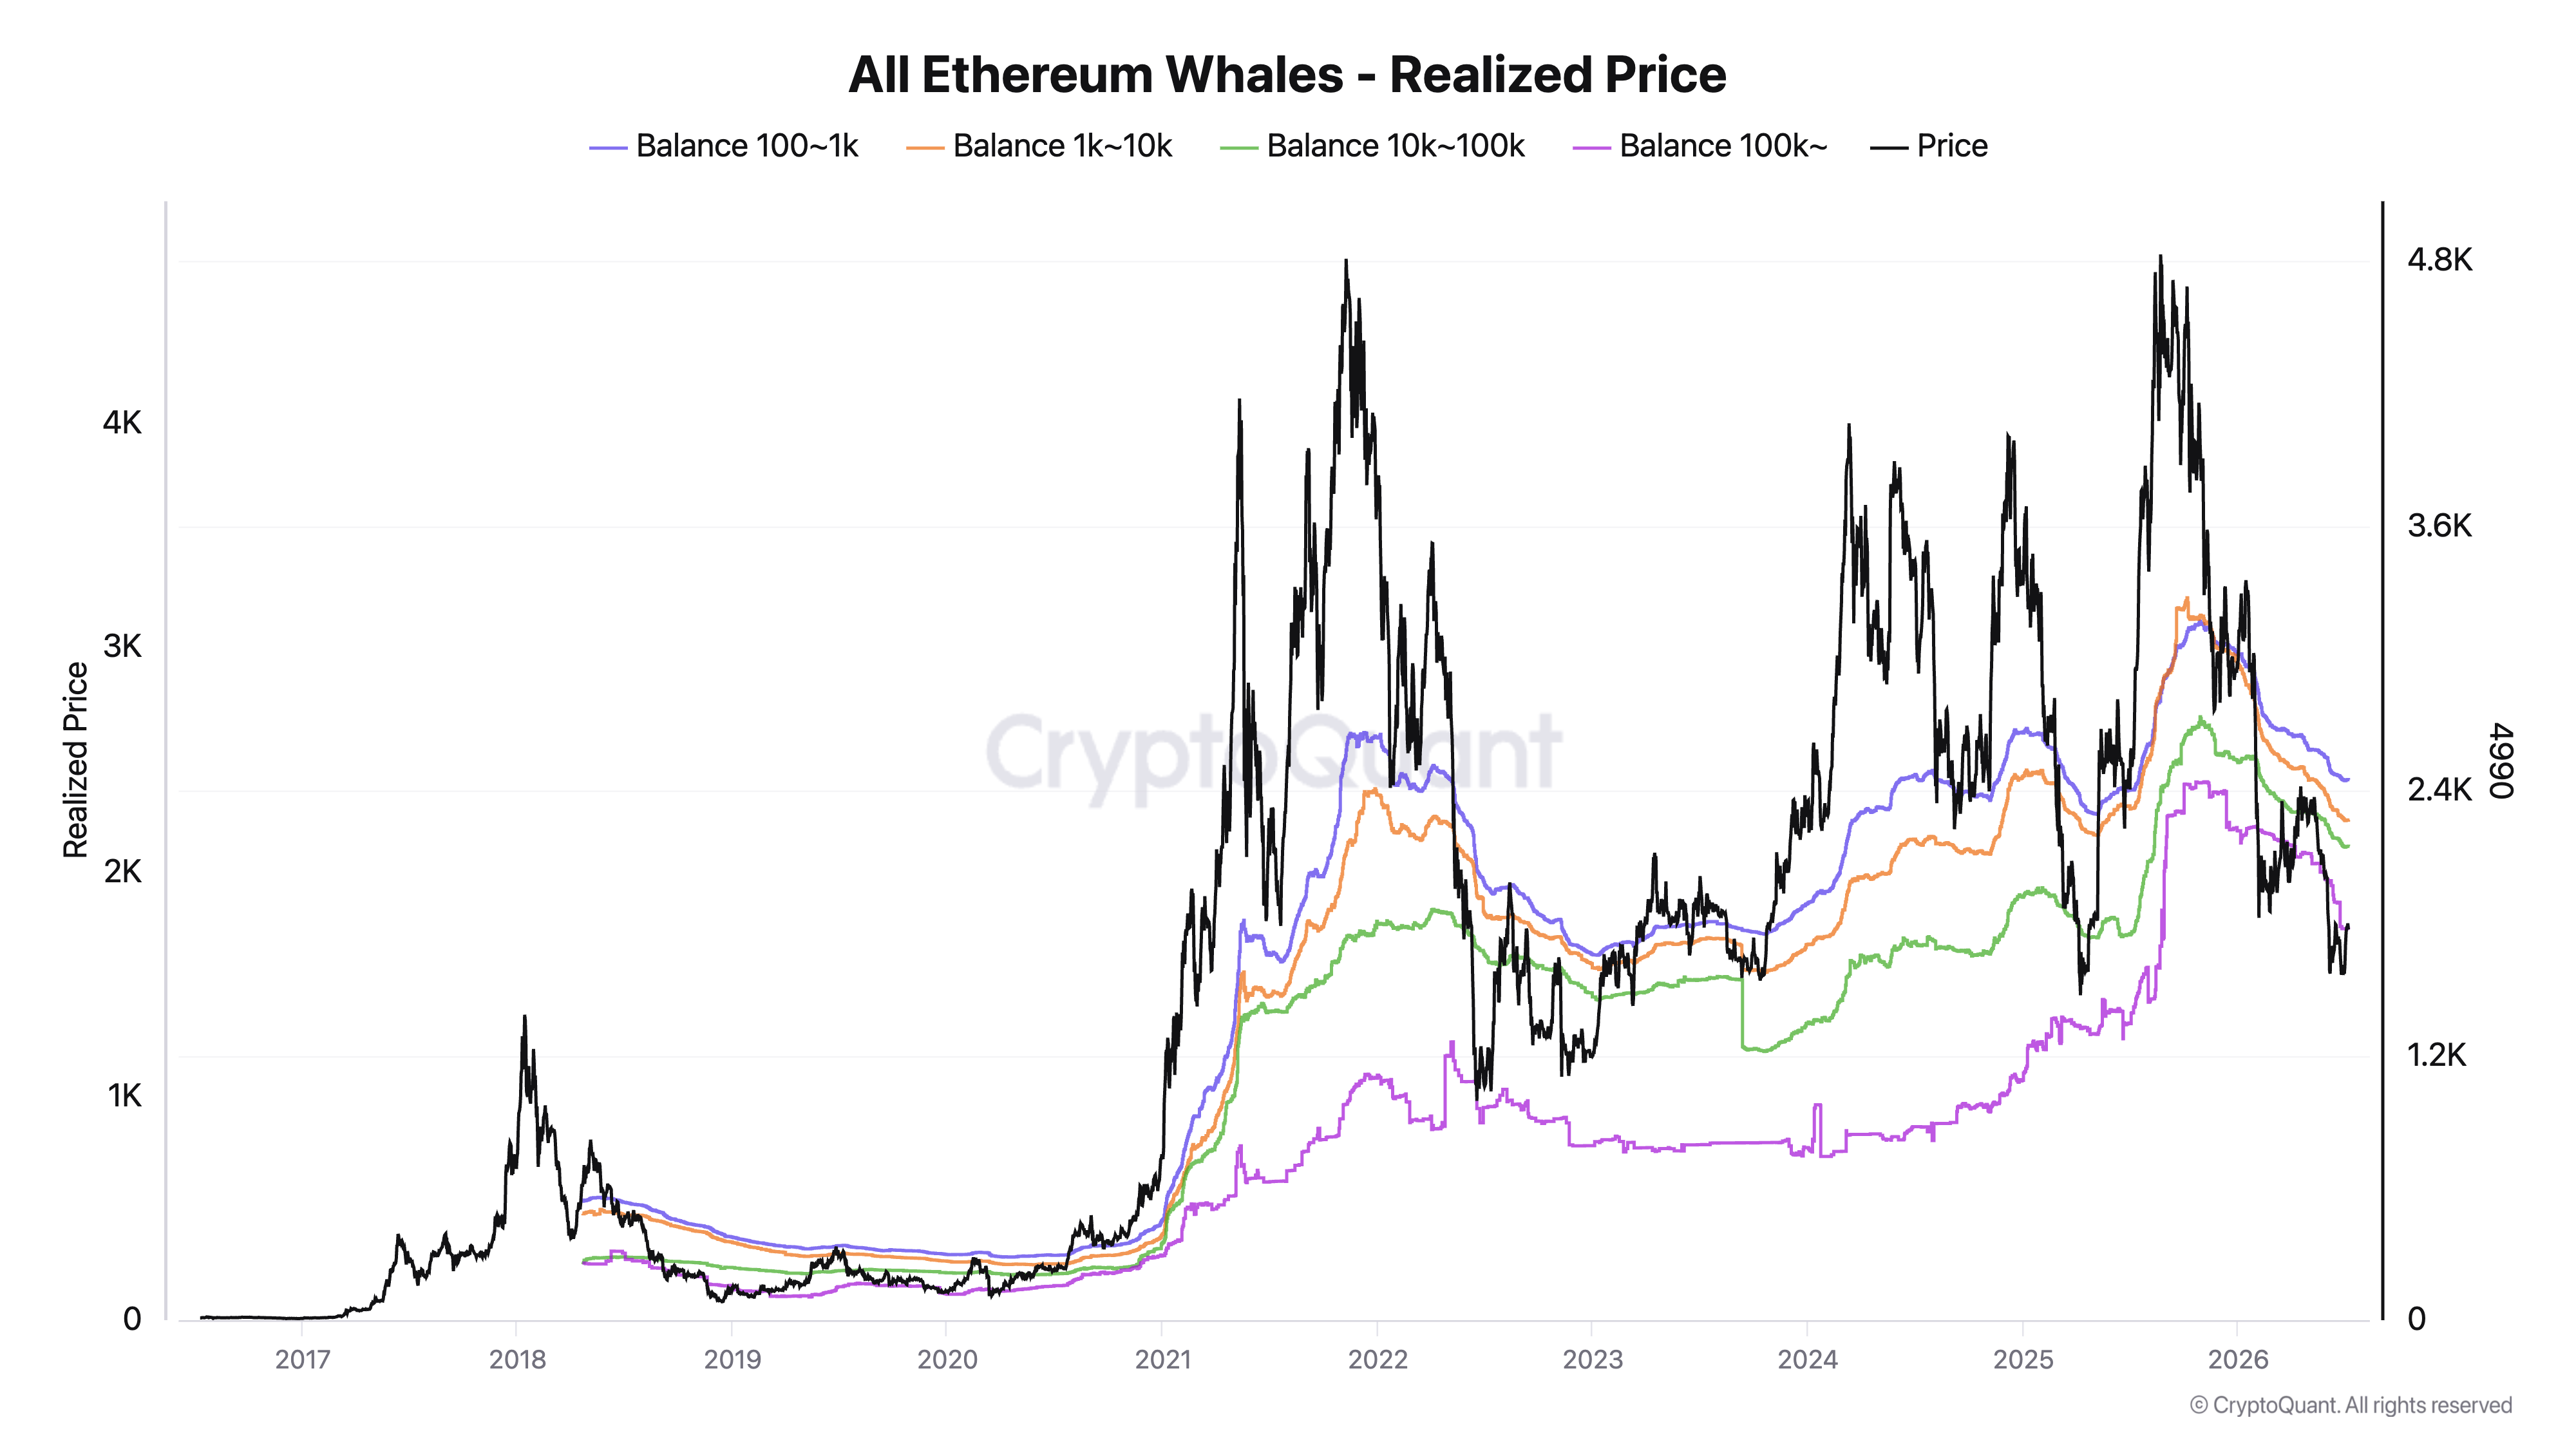
The 10,000-100,000 ETH group (green line) has an average cost basis of $2,050.
For the unversed, realized price estimates the average price at which a cohort acquired its ETH. When spot price trades below that level, the group is sitting at an unrealized loss on average.
That puts a broad $2,000-$2,400 cost-basis cluster above ETH. Any recovery into the region may face selling pressure from underwater whales looking to exit near breakeven, making a sustained rebound toward $2,000 harder.
Notably, the realized price of the 100,000 ETH-plus cohort (purple) has dropped sharply toward the $1,700 area, roughly matching ETH’s current price. The black line near $1,770 represents ETH’s spot price.
That makes the $1,700 region an important on-chain line in the sand. A decisive ETH drop below the largest whales’ realized price would leave even the market’s biggest holders underwater on average, adding weight to the megaphone breakdown scenario toward $1,600.