Bitcoin (BTC) is consolidating near the key zone of $50,000 to $60,000 after the sharp pullback from the September 2025 highs. Gold (XAU) is also trading below $4,350 after rebounding from the key $3,950 support. The recent oil spike from the Middle East escalation has added more uncertainty in the short term. The next major move in Bitcoin will depend on whether the price can stay above $50,000 and whether Bitcoin to gold ratio can hold above 13.

Bitcoin Price Forecast: $50,000-$60,000 Support Holds the Key
The long term outlook for Bitcoin prices remains bullish despite the strong drop from the September 2025 highs. But the weekly chart for Bitcoin shows that the price is currently consolidating around the 200 SMA. This SMA lies around the $50,000 to $60,000 range which is also the strong support seen by the descending trend line from the March 2024 highs.
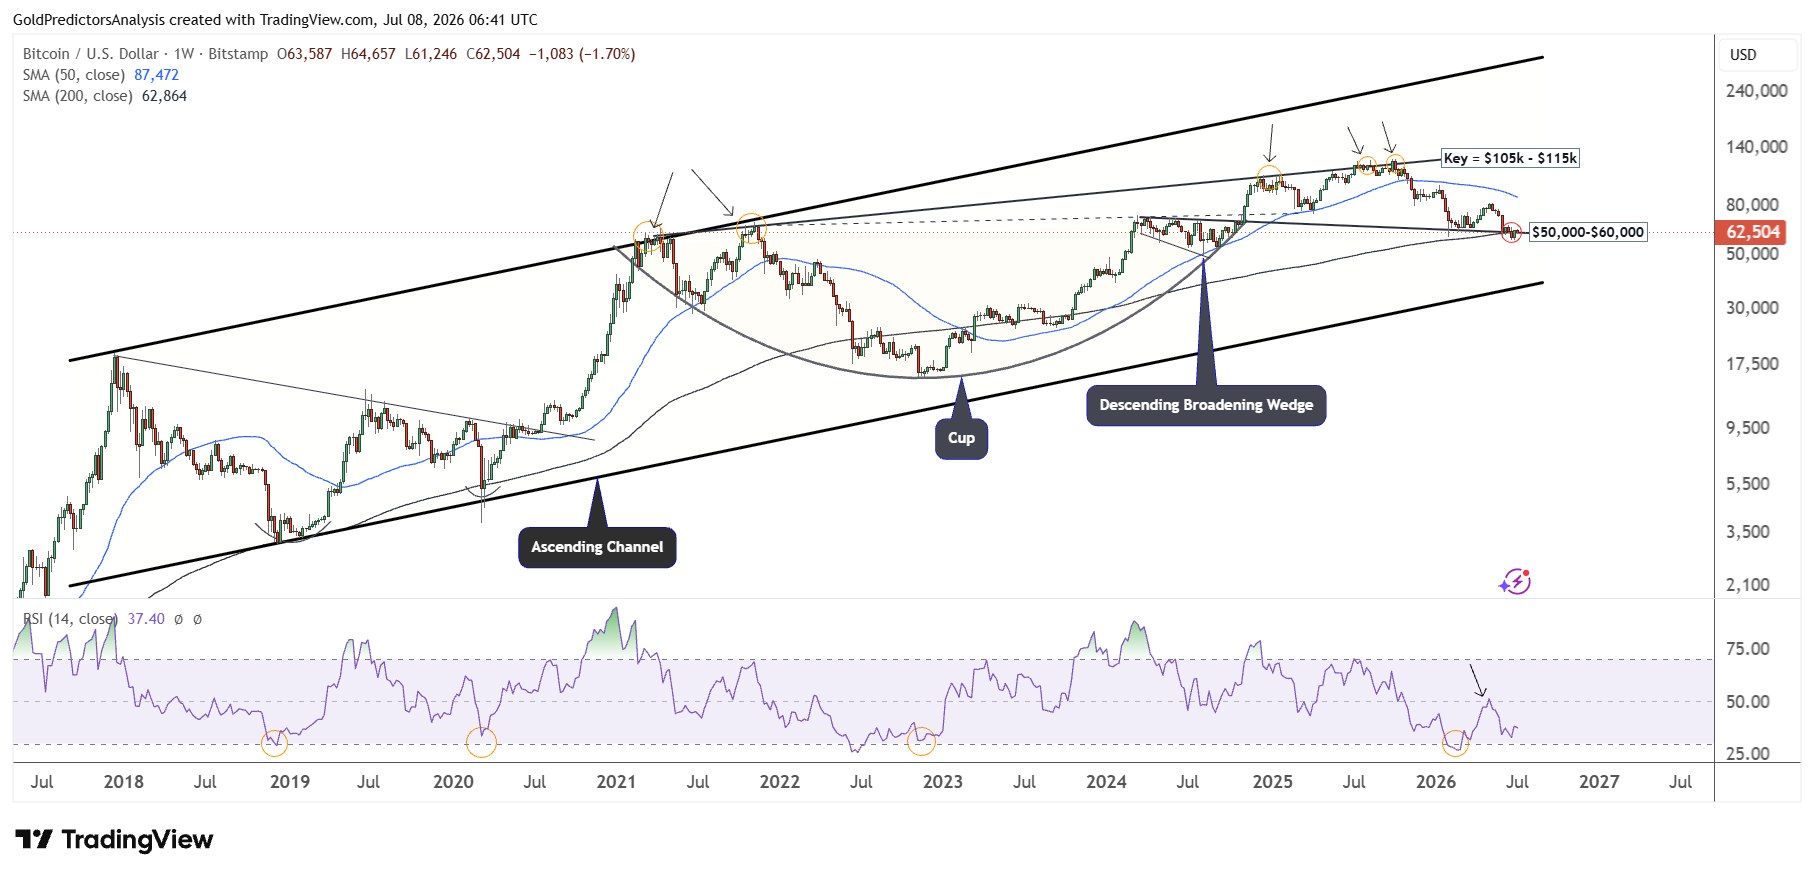
The intersection of this support indicates that Bitcoin prices must rebound back towards the 50 SMA on the weekly chart at $85,000. But the rebound so far looks weak as the price looks uncertain in the short term due to the geopolitical uncertainty.
If the current support zone holds, then the next rally in Bitcoin may start from the current region. But a break below the $50,000 level will open the door for strong drop in Bitcoin towards $35,000 to $40,000. This support is seen by the ascending channel pattern on the weekly chart.
Gold Price Forecast
Every new Gold analysis as it publishes, today's technical signal and key levels, live price — on one page.
See all Gold forecastsBitcoin Broadening Wedge Tests Major Support
The daily chart for Bitcoin shows that the price is consolidating around the support of the ascending broadening wedge pattern. This support lies around the $50,000 to $60,000 area. If the current support zone holds, then the rally may face immediate resistance towards the $70,000 to $75,000 area. A break above $75,000 could push the price towards $80,000.
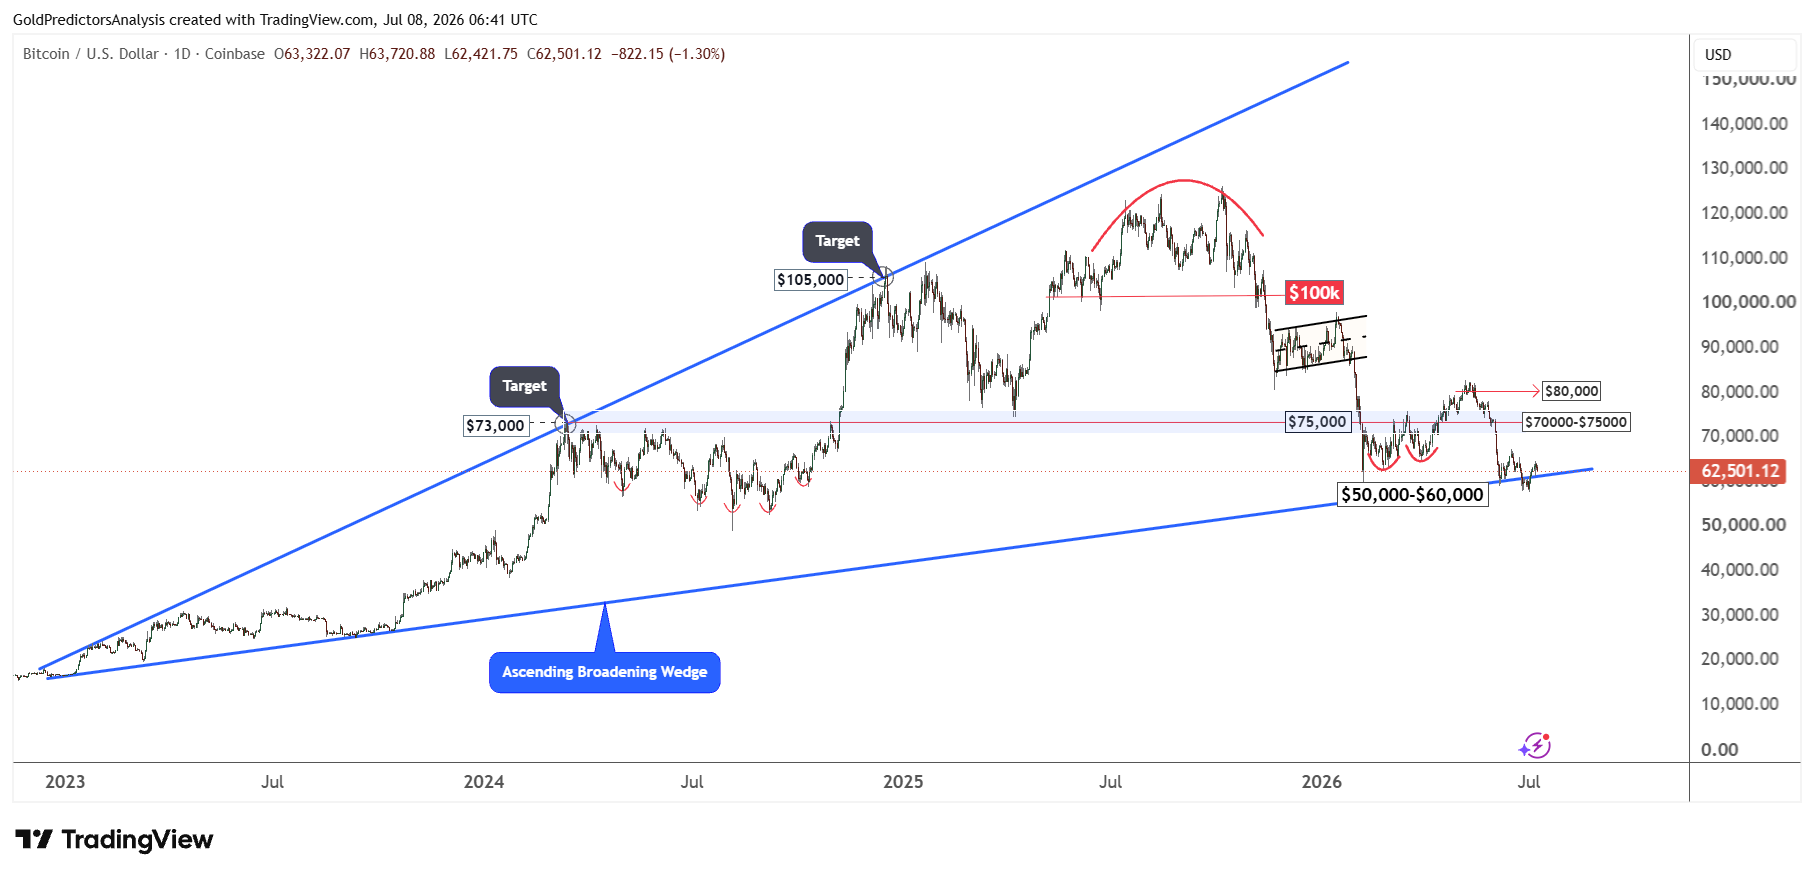
However, if the Bitcoin price fails to hold the $50,000 level, then it may open the door for a drop towards the $35,000 region. So far, the emergence of top patterns around the $125,000 area and then the bear flag patterns indicate a negative trend. But the importance of the current support region suggests that a rebound may develop from the current zone. The short term direction for Bitcoin remains uncertain within this zone.
Bitcoin’s $64,700 Breakout May Signal Recovery
The 4-hour chart for Bitcoin also shows that prices remain uncertain within this zone. The sharp shadows on 4-hour candles were observed multiple times in June as seen in the chart below.
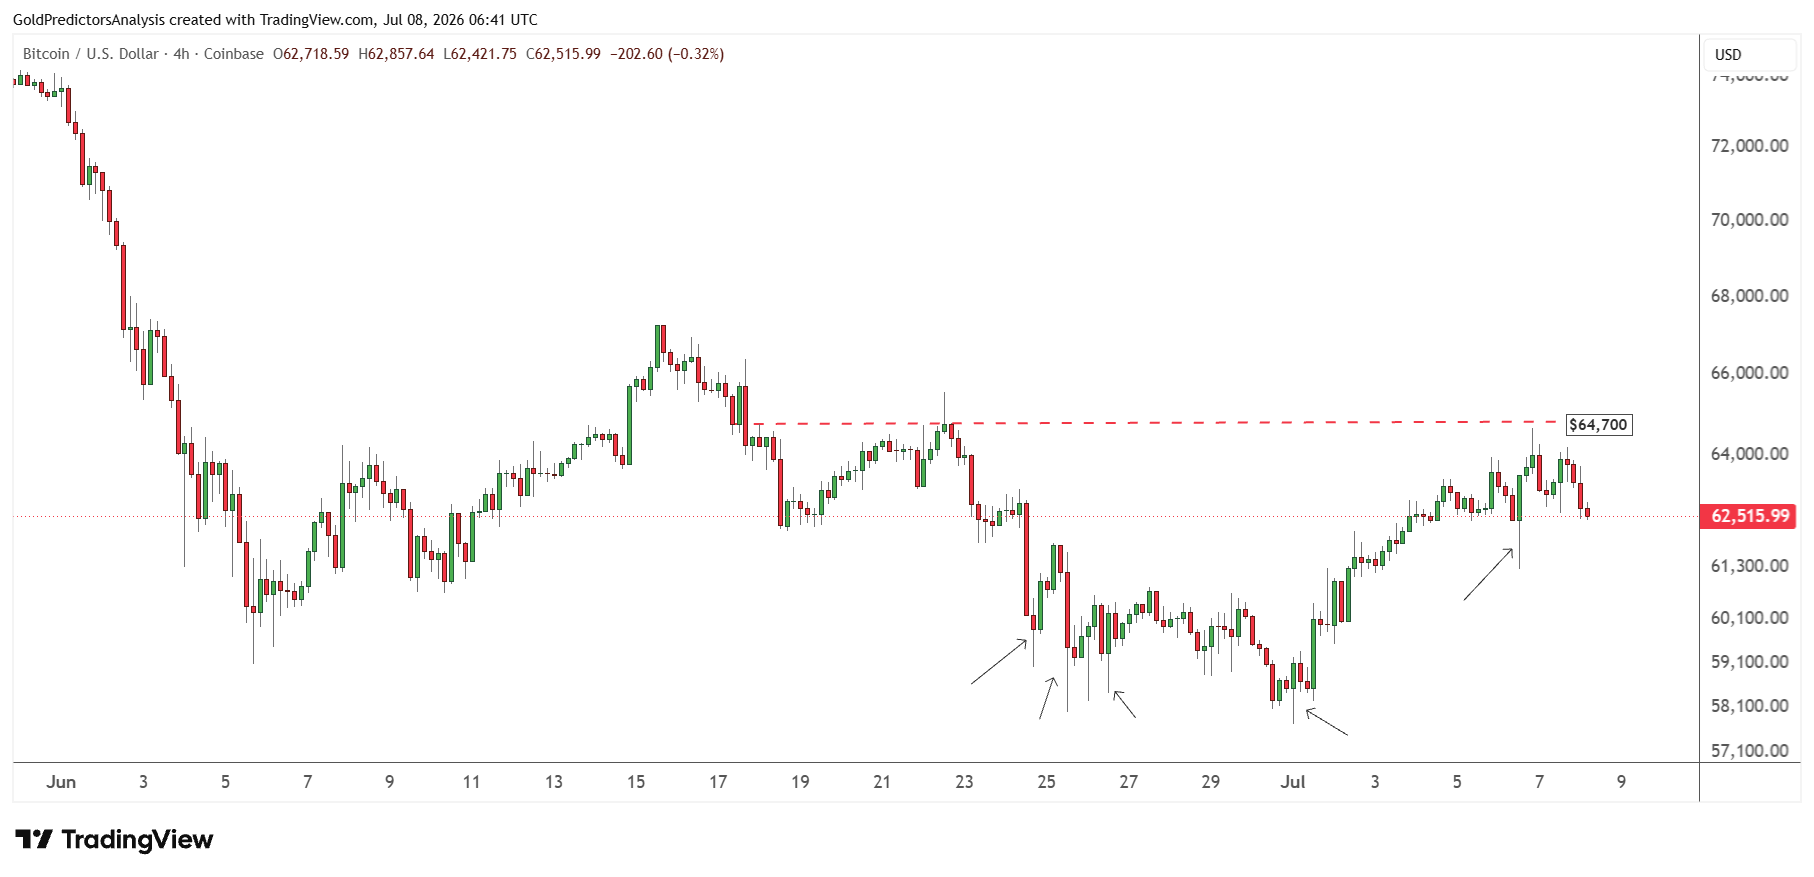
These shadows highlight positive action in Bitcoin in the short term. This positive action triggered a rally towards $64,700. But the rally was limited as Bitcoin prices continued to drop after the $64,700 level. A break above $64,700 may push Bitcoin back to $67,200. If prices break above $67,200, it will likely push Bitcoin towards $75,000. But if Bitcoin fails to break above $64,700, it may face further pressure in the short term.
Gold vs Bitcoin: Which Asset Looks Better Now?
It is interesting to note that gold prices also rebounded from the long-term support of $3,950 as Bitcoin prices also rebounded from $58,000. But gold prices also remain under pressure due to the oil spike and the expectations of Fed rate hikes. The market is now waiting for the FOMC minutes which may further drive the next move in precious metals. But the overall short term direction for gold and Bitcoin remains uncertain.
The Bitcoin-to-gold ratio shows that Bitcoin prices are forming strong support around current levels as the ratio rebounds from extremely oversold levels. This rebound may introduce support in the Bitcoin market and push prices higher. But a break below the 13 level in the Bitcoin-to-gold ratio will likely push the ratio towards the 9 area. If this scenario unfolds, then Bitcoin will likely drop further below $50,000.
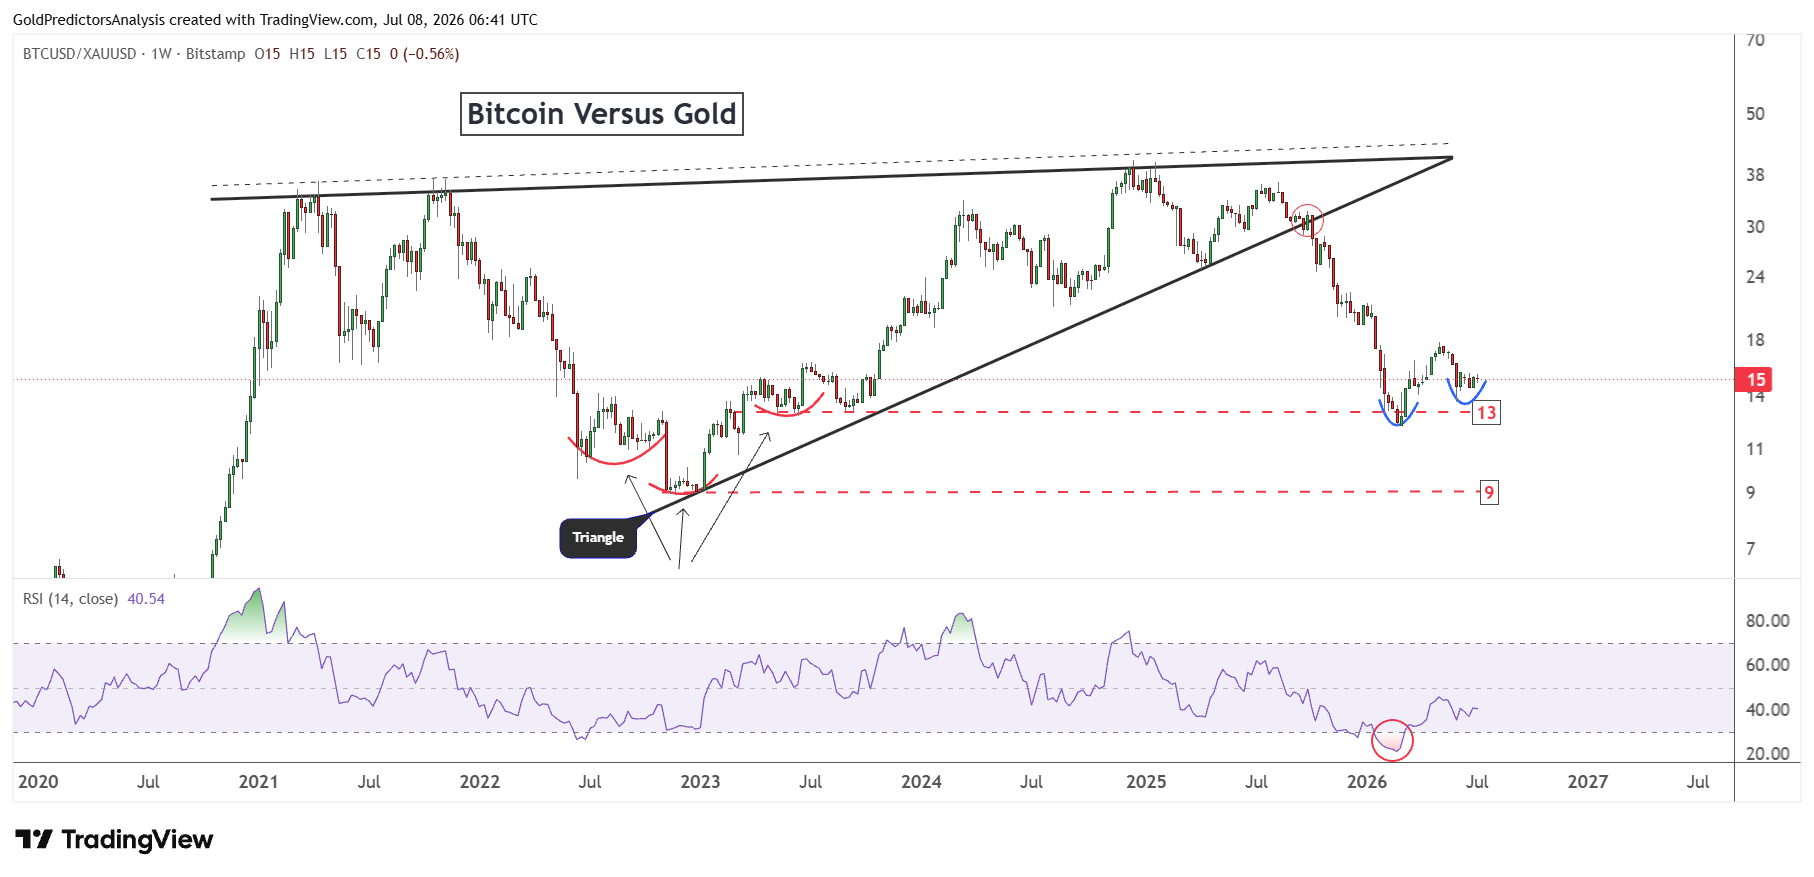
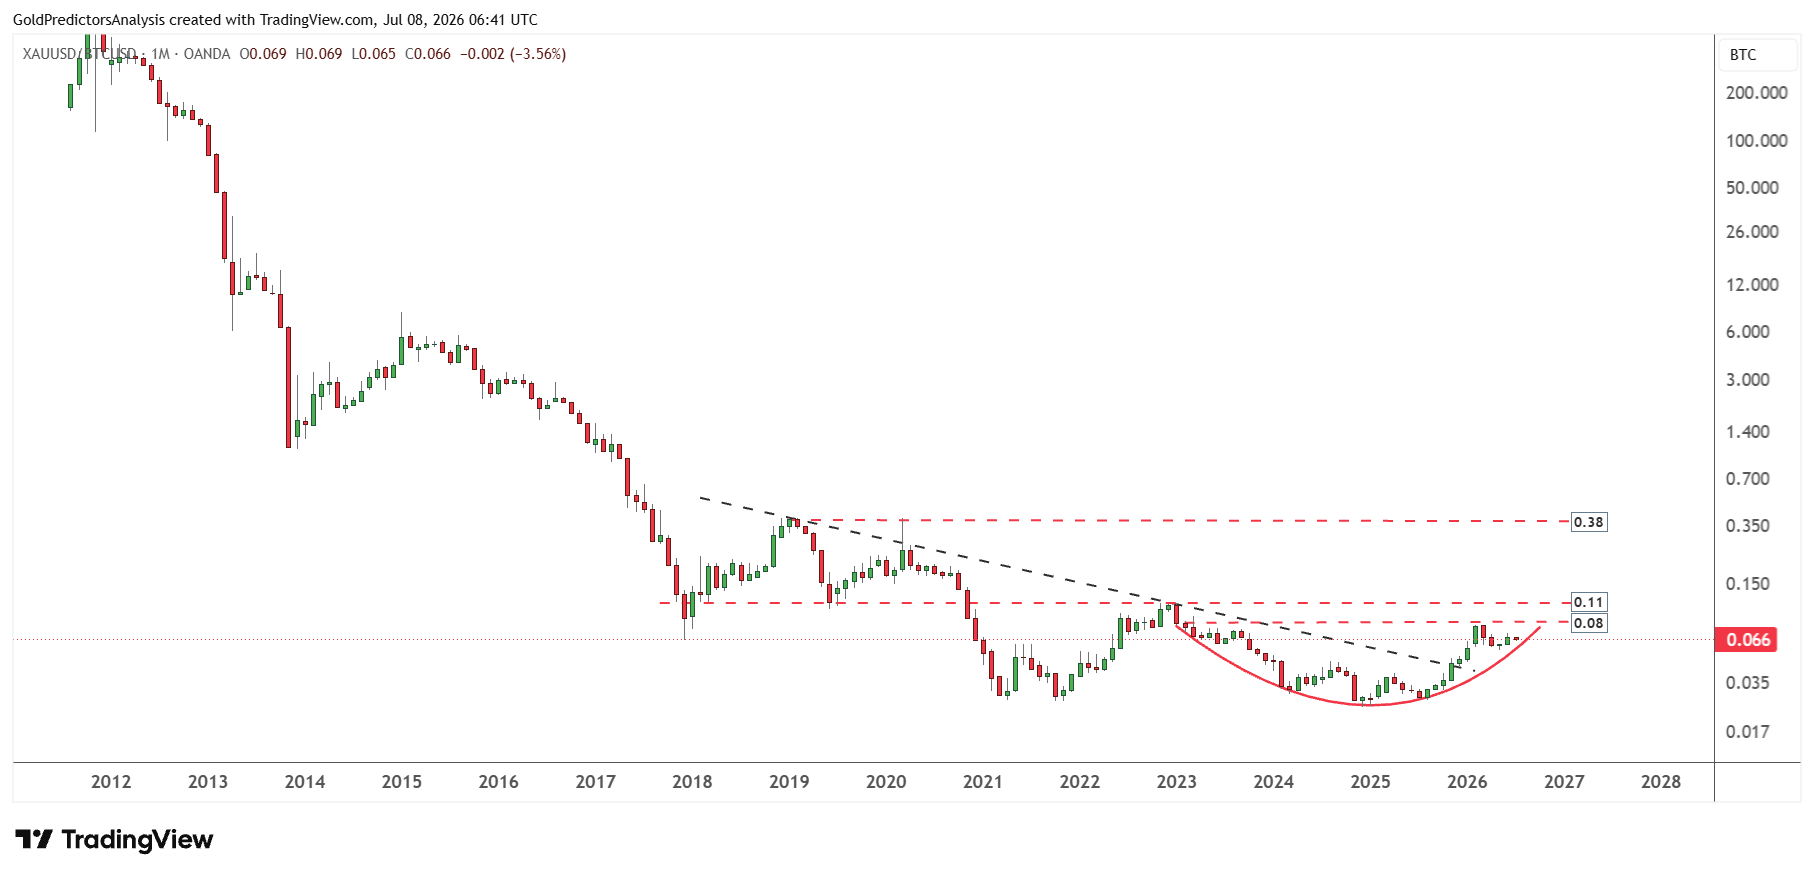
A similar situation is also observed on the gold-to-Bitcoin ratio, which failed to break above the 0.11 level. A break above 0.11 is required to push the ratio towards the 0.30 to 0.38 level. But the ratio broke the descending trend line coming from December 2018. This indicates that the ratio is attempting to shift higher. But as long as the ratio remains below 0.11, it will likely support Bitcoin prices in the short term.
Bottom Line
Bitcoin and gold are defending key support levels, but Bitcoin could show more upside if it holds the $50,000-$60,000 support range. The first positive sign will be a break above $64,700 followed by a test of $67,200 that could drive the move to $75,000 and $80,000. But the risk is still high. A break below $50,000 will invalidate the bull market formation and could send Bitcoin prices to $35,000-$40,000.
Gold is seen as a more defensive commodity as geopolitical risk can support demand. But Fed rate hike expectations may limit the near term rally. So, if the risk sentiment improves, Bitcoin could perform better. But gold can perform if the uncertainty remains high. If the Bitcoin to gold ratio holds above 13, it may keep the strength in the Bitcoin market above $50,000.
Read more: BTC Eyes $50,000 as Risk-Off Sentiment Grows