
Oil prices and the US dollar gained momentum as the Middle East tensions escalated, which put pressure on gold (XAU). The increase in oil prices could raise the inflation expectations. Higher inflationary pressures are causing traders to worry that the Federal Reserve may keep interest rates higher for longer. The higher interest rates are negative for gold.
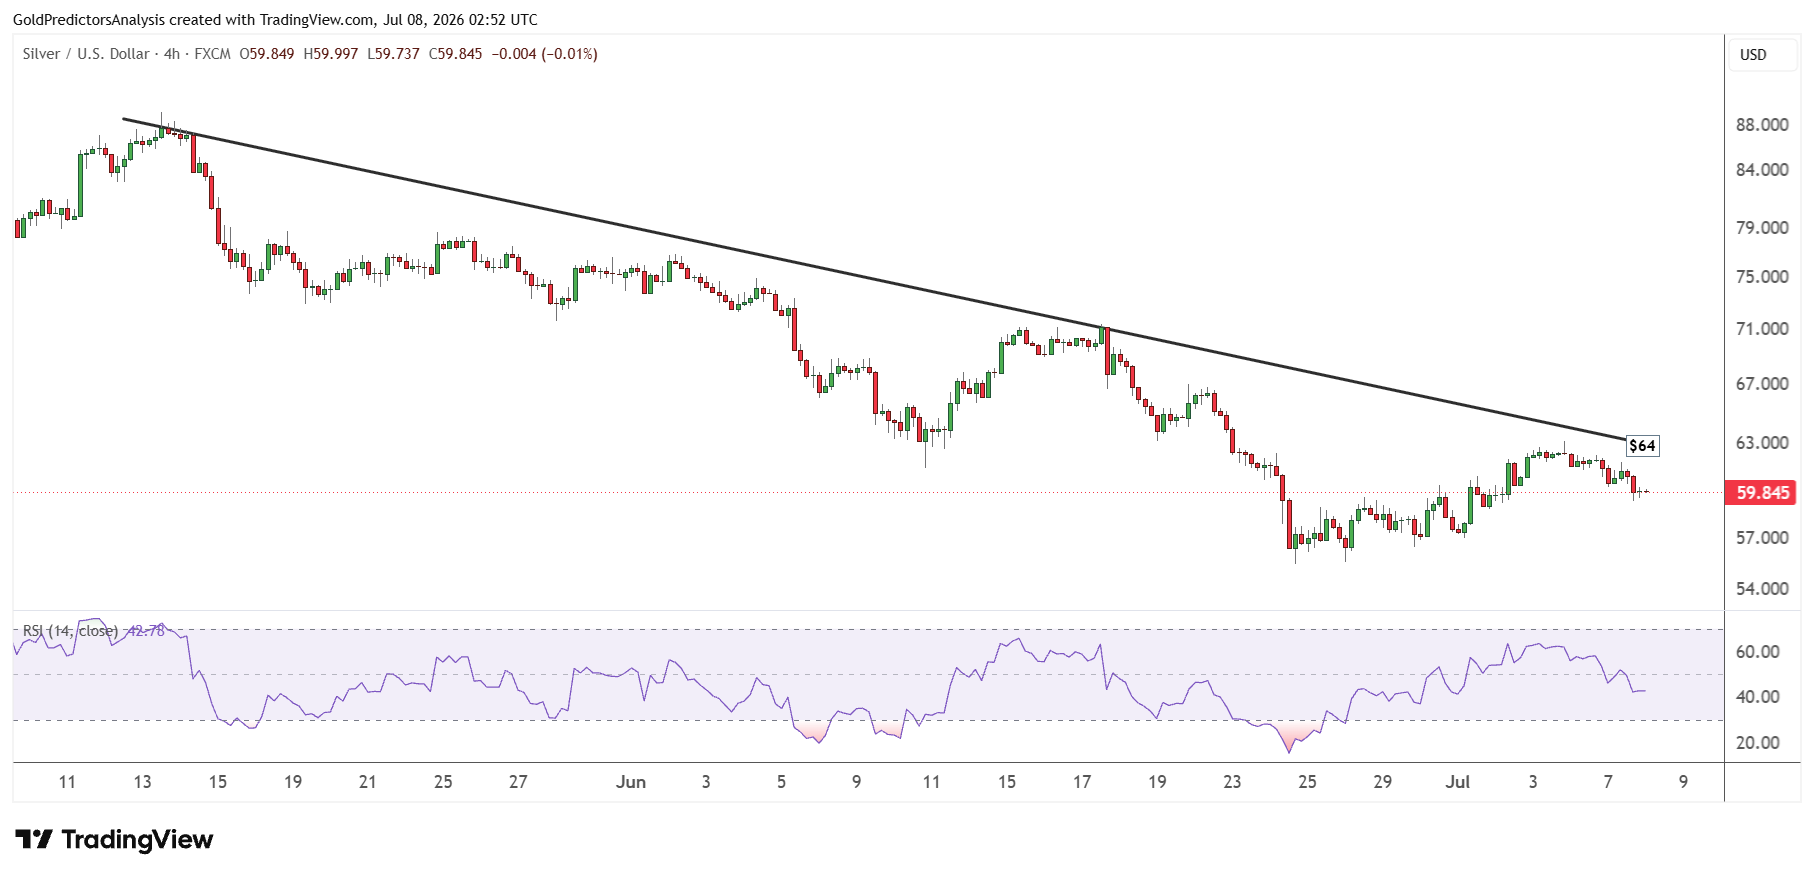
Silver (XAG) also faces pressure from the key resistance of $64. Silver is also sensitive to growth and industrial sentiment. The upside in silver might be capped when the market fears a slowdown in demand.
But the downside in gold and silver might be capped if the geopolitical tensions escalate further. The long term demand outlook also looks strong due to China’s larger gold reserves and Hong Kong’s new gold trading measures. This indicates that the gold price may face short-term pressure but the long-term outlook remains robust. Therefore, any correction in gold and silver prices may offer a buying opportunity for long term investors.

Gold Price Forecast: Oil Spike and Strong Dollar Pressure Bullion
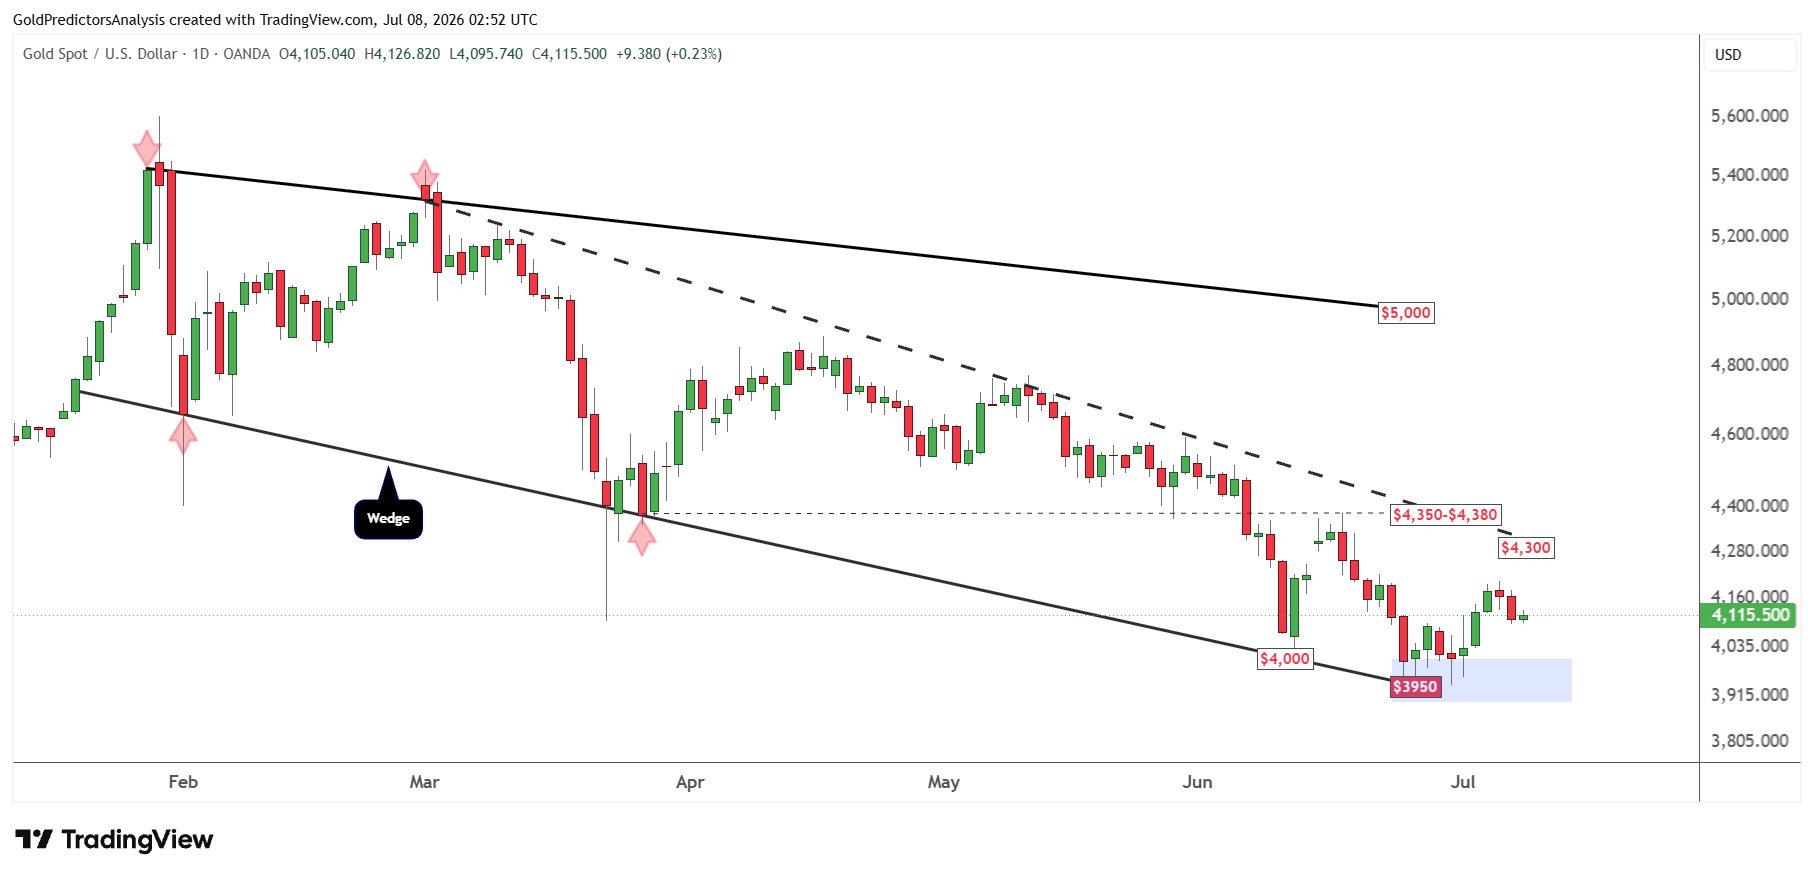
XAUUSD Daily: $3,950 Support Faces $4,350 Breakout Test
The daily chart for spot gold shows that the price has rebounded from the strong support of $3,950. But the rebound so far has been weak and faces resistance at the $4,200 level.
As per our discussion in the previous analysis, the immediate resistance remains the black dotted trend line at $4,300. A break above this level will push the gold price towards the $4,350 area. Only a break above $4,350 will confirm further upside in the gold market towards $4,500. On the other hand, $3,950 is protecting the downside, and consolidation around these levels indicates price uncertainty.
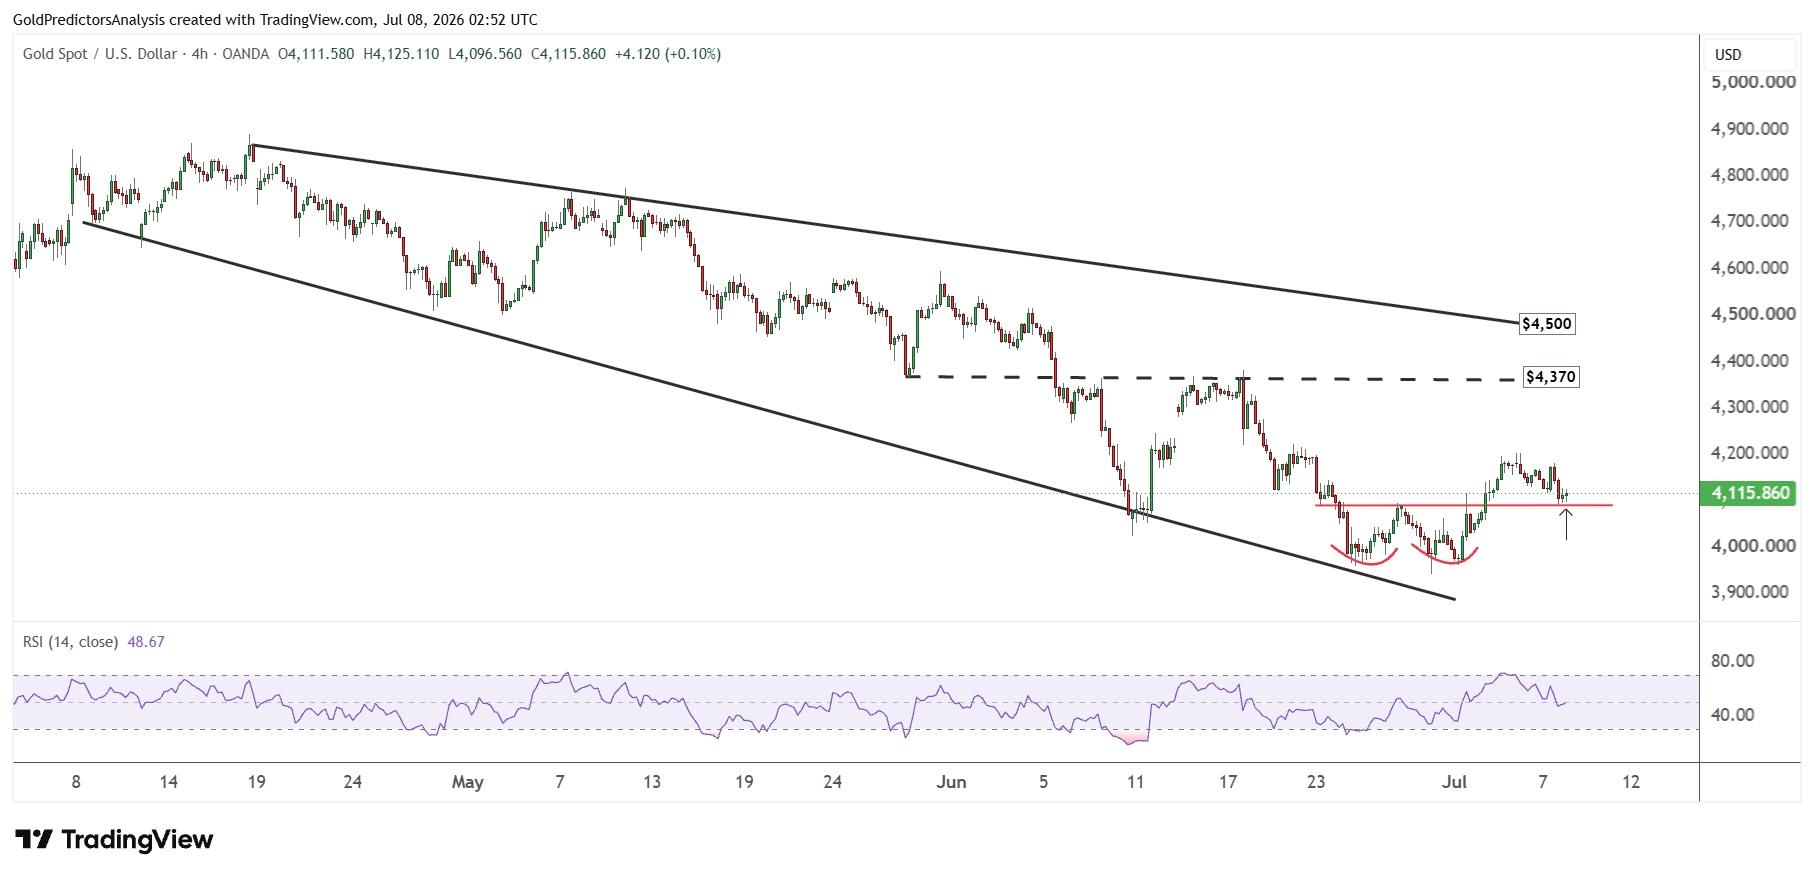
XAUUSD 4-Hour: $4,100 Neckline Decides Gold’s Short-Term Move
The 4-hour chart for spot gold also shows the formation of broadening wedge pattern at the strong support of $3,950. The price has formed a double bottom pattern at $3,950 and broken above the $4,100 level.
Gold Price Forecast
Every new Gold analysis as it publishes, today's technical signal and key levels, live price — on one page.
See all Gold forecastsThe correction from $4,200 has pushed the price towards the neckline of the double bottom at $4,100. But a break below $4,100 will indicate further downside. If the price holds $4,100, it will likely rally towards $4,350 in the short term.
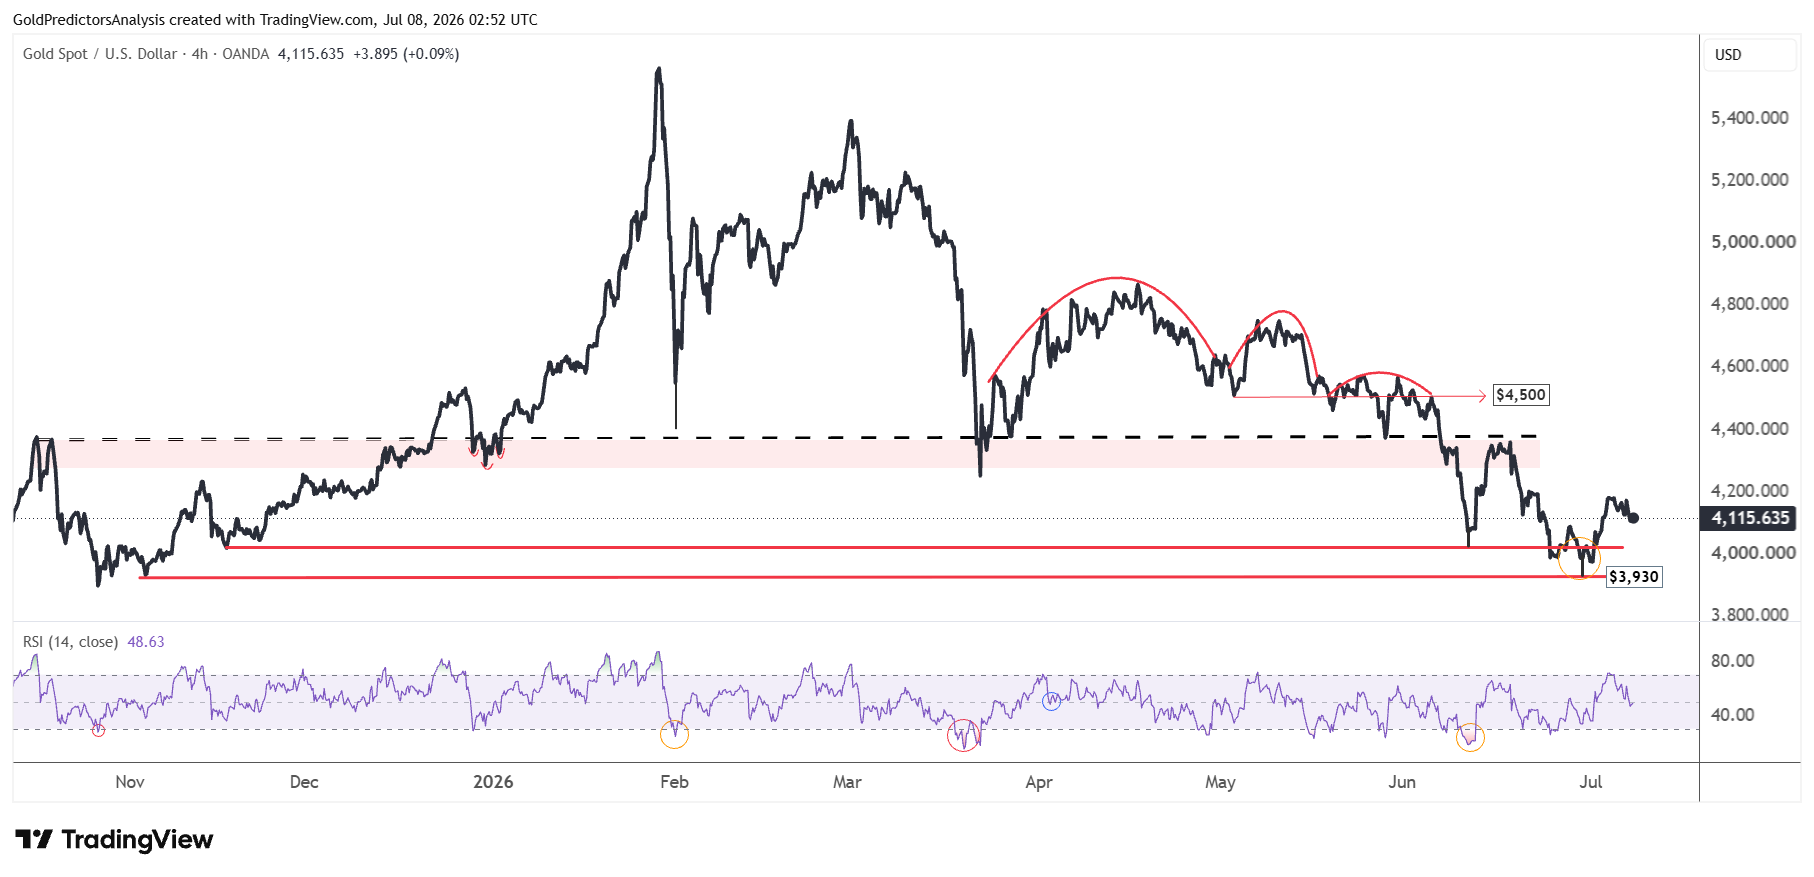
The importance of the $3,950 to $4,000 area is evident in another chart. The chart below shows that the strong resistance now remains in the $4,350 to $4,400 area. A break above this zone is required to neutralize the negative trend.
Silver Price Forecast: $64 Resistance Caps Upside Momentum
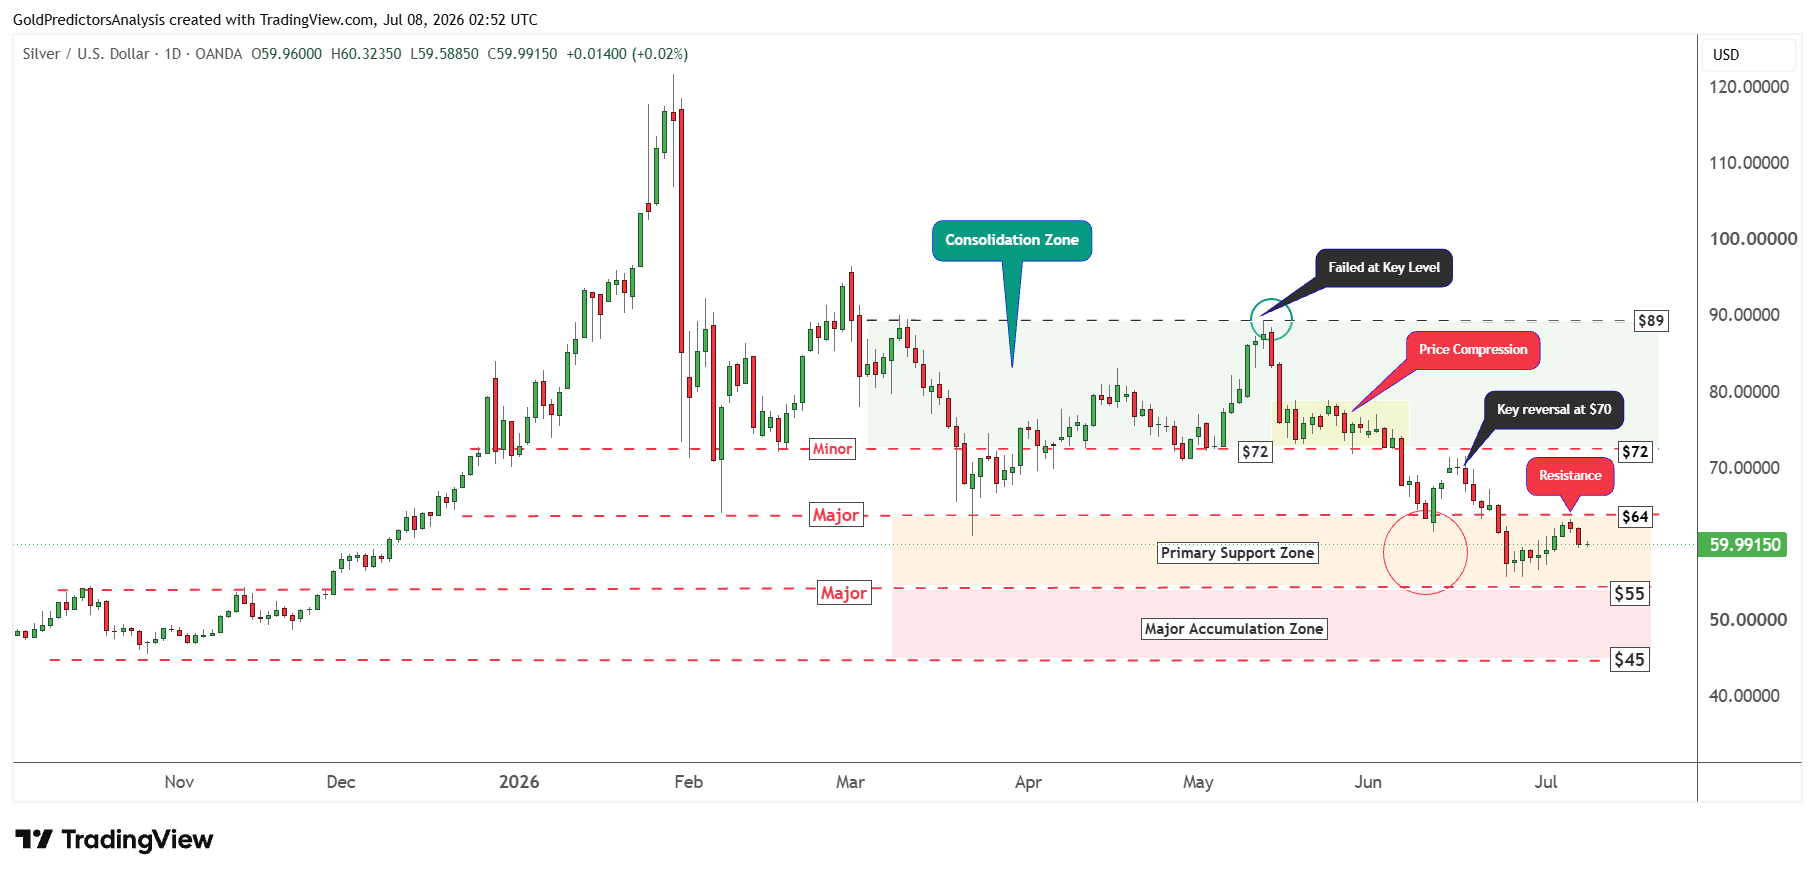
XAGUSD Daily: $55 Support Protects Silver from Deeper Losses
The daily chart for spot silver shows that the price rallied from support at $55 and hit the strong resistance of $64. This resistance is the upper boundary of the primary support region as seen in the chart below.
A failure to break above $64 has introduced some weakness in silver. The immediate support remains the $55 area. But a break below $55 will push the silver price towards the major accumulation zone. This zone lies between the $45 and $55 range and attracts the long term buyers.
XAGUSD 4-Hour: Descending Wedge Keeps Silver in Tight Range
The 4-hour chart for spot silver shows that the price rebounded from the $55 area to the resistance of the wedge pattern at the $64 area. But the price failed to break above the $64 region. As long as the silver remains below the $64, the price has the potential to drop to $55.
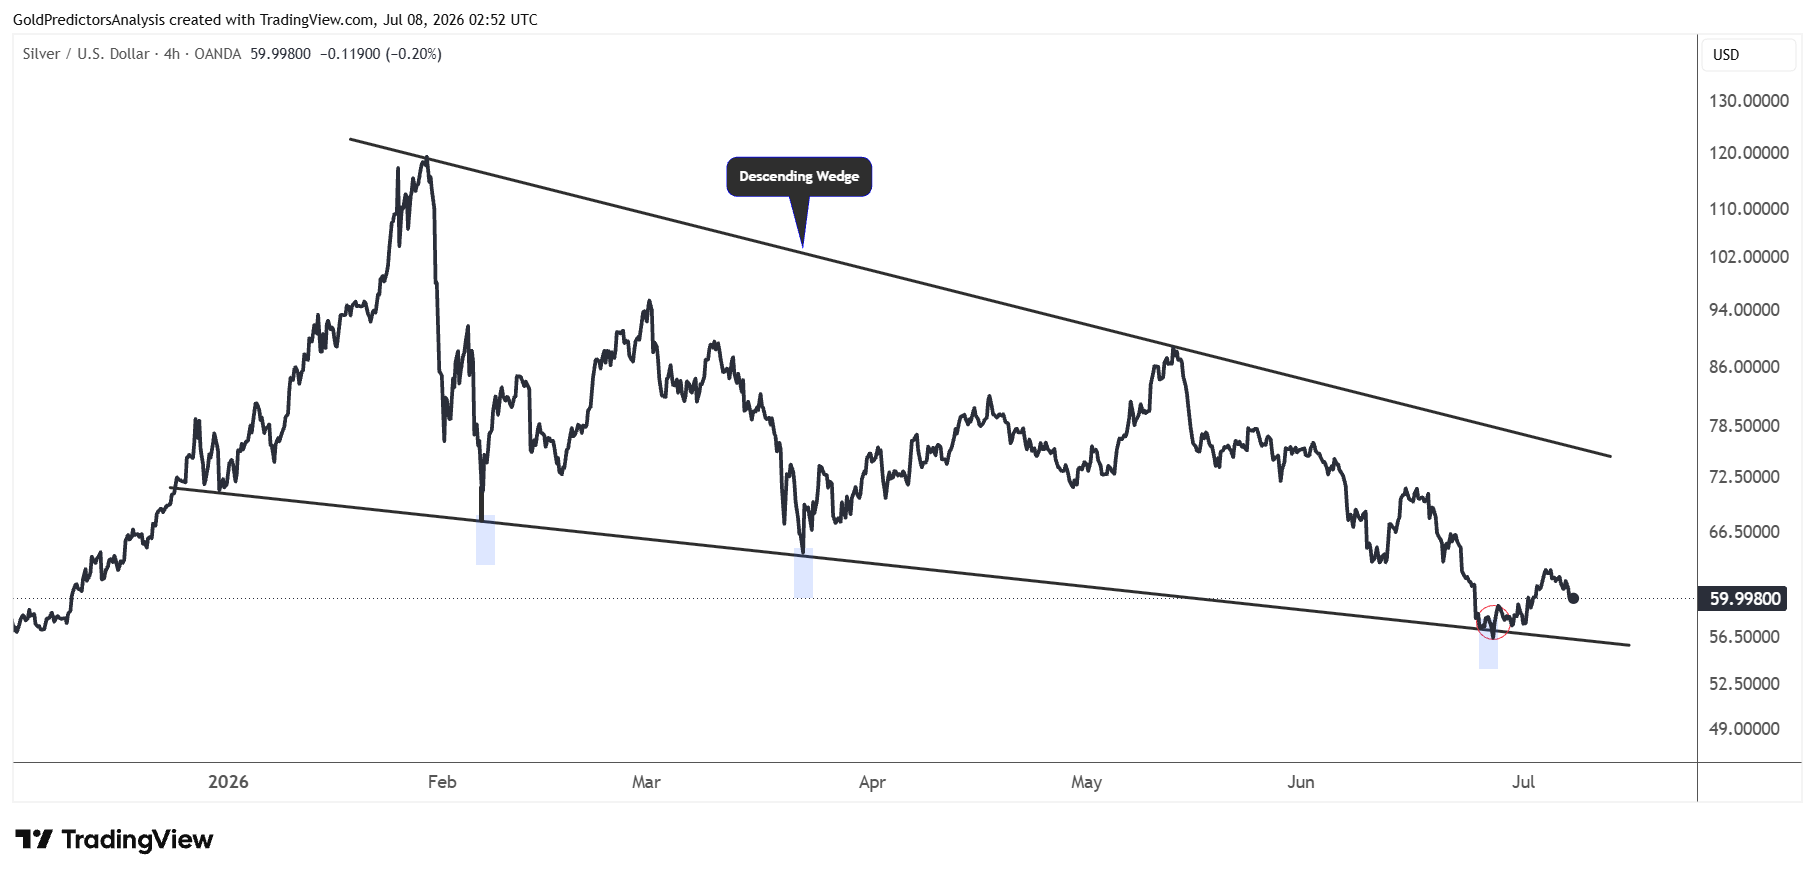
Silver prices are consolidating in a tight range as the price approaches the end of the descending wedge pattern. Only a break above $72 will likely indicate a meaningful upside in the silver market.
The importance of $64 is also evident in another chart which shows a descending line stretching from the May 2026 highs. If the price fails to break above $64, it will likely continue to consolidate between $55 and $64.
Bottom Line
Gold and silver remain under short-term pressure due to the rising oil prices, the U.S. dollar and increased Fed rate expectations. The strong support in gold is the $3,950. The market must hold this support to prevent further losses. But a break above $4,350 will indicate further upside to $4,500. Silver must also break above the $64 resistance to move to $72. The price must hold the $55 as an important support zone.
But the longer-term outlook remains positive due to the geopolitical risks, China’s gold buying and the new gold trading laws in Hong Kong. Therefore, these corrections in metals will likely lead to the development of another setup for the next surge. The metals are entering critical buy zones, where prices may prepare for the next upside move.
Read more: Fed Minutes Put Key Breakout Levels in Focus for Gold, Silver and Platinum