Chip Rout Sends Nasdaq Below the 50-Day
The Nasdaq Composite settled at 25,818.69 on Tuesday, down 302.47 or 1.16%. A semiconductor selloff that started overnight in Seoul and swept through Europe dropped the index below its 50-day moving average by the close.
The S&P 500 finished at 7,503.85, down 33.58 or 0.45%. The Dow closed at 52,925.15, off 130.76 or 0.25%, after pushing through 53,000 for the first time in the morning and surrendering most of it by the bell. Five of eleven S&P 500 sectors ended lower.

Daily Nasdaq Composite Index (IXIC) Technical Analysis
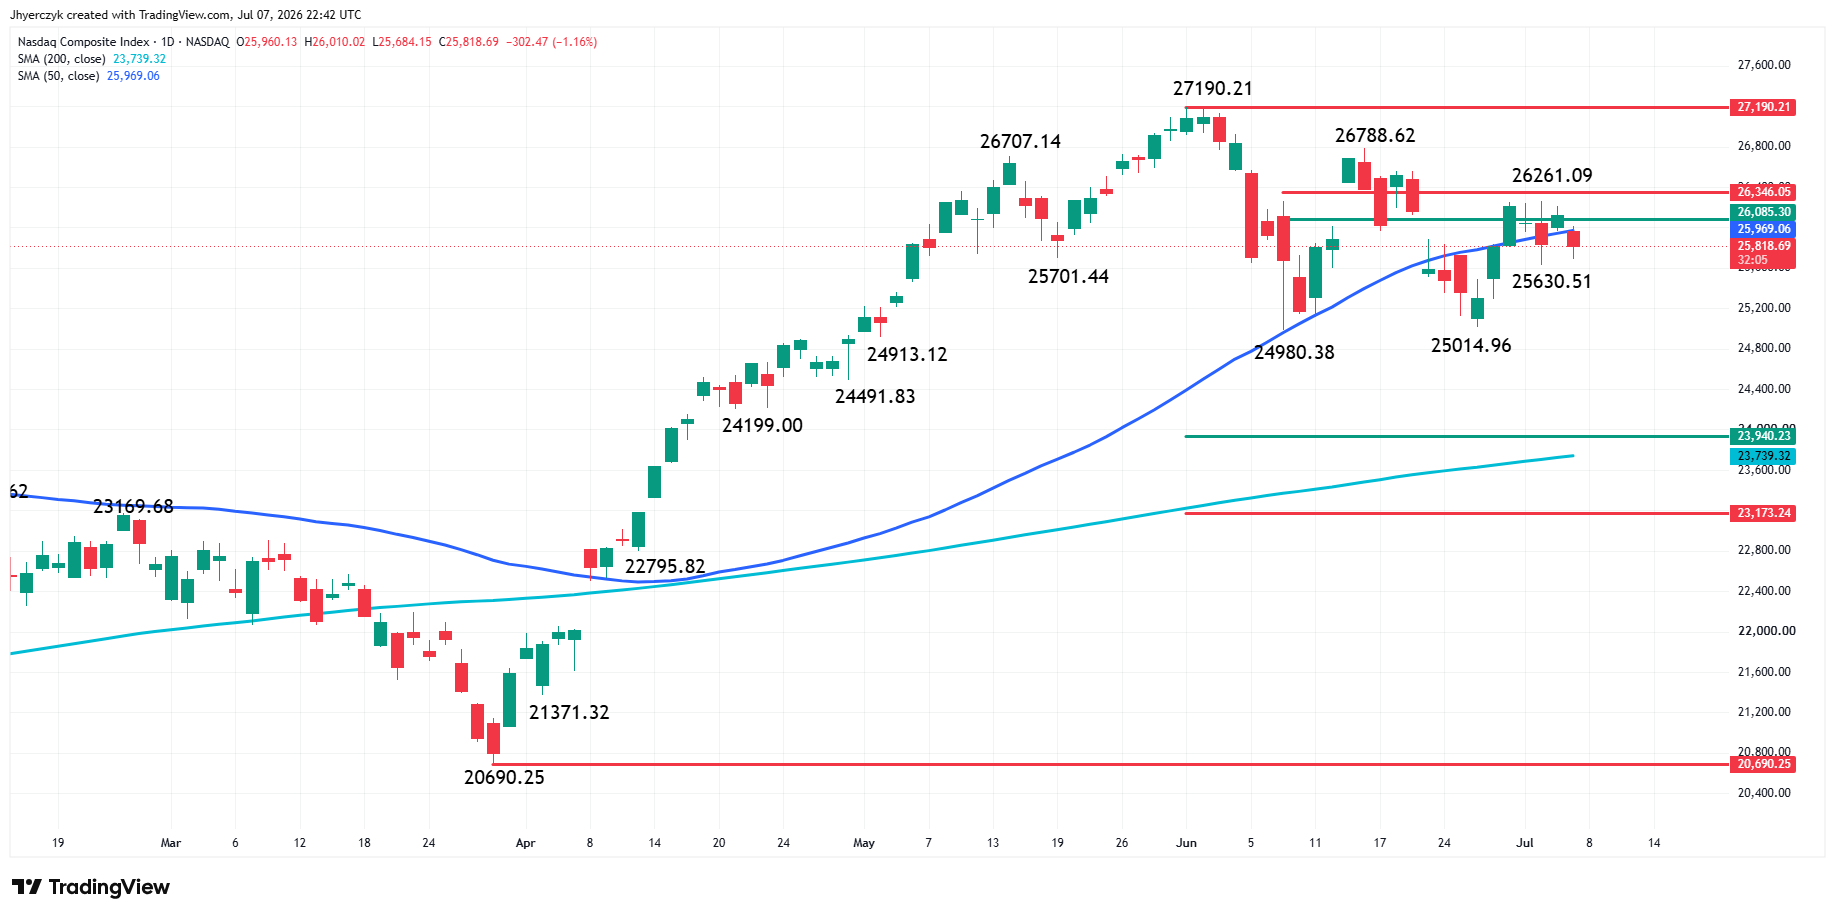
The tech heavy Nasdaq Composite Index settled under the 50-day moving average at 25969.06. This opens the door to a lower opening on Wednesday. The first sign of weakness will be a breakdown under the minor bottom at 25603.51. If sellers come in heavy under this level then look for the selling to possibly extend into the two main bottoms at 25014.96 to 24980.38.
The latter is a potential trigger point for an acceleration to the downside with the long-term retracement zone at 23940.23 to 23173.24 the next major target. This includes the 200-day moving average at 23739.32.
Overcoming the 50-day MA will be an early sign of short-covering, but I wouldn’t get too excited about the upside potential until new buyers drive through the short-term Fib level at 26346.05.
Daily S&P 500 Index (SPX) Technical Analysis
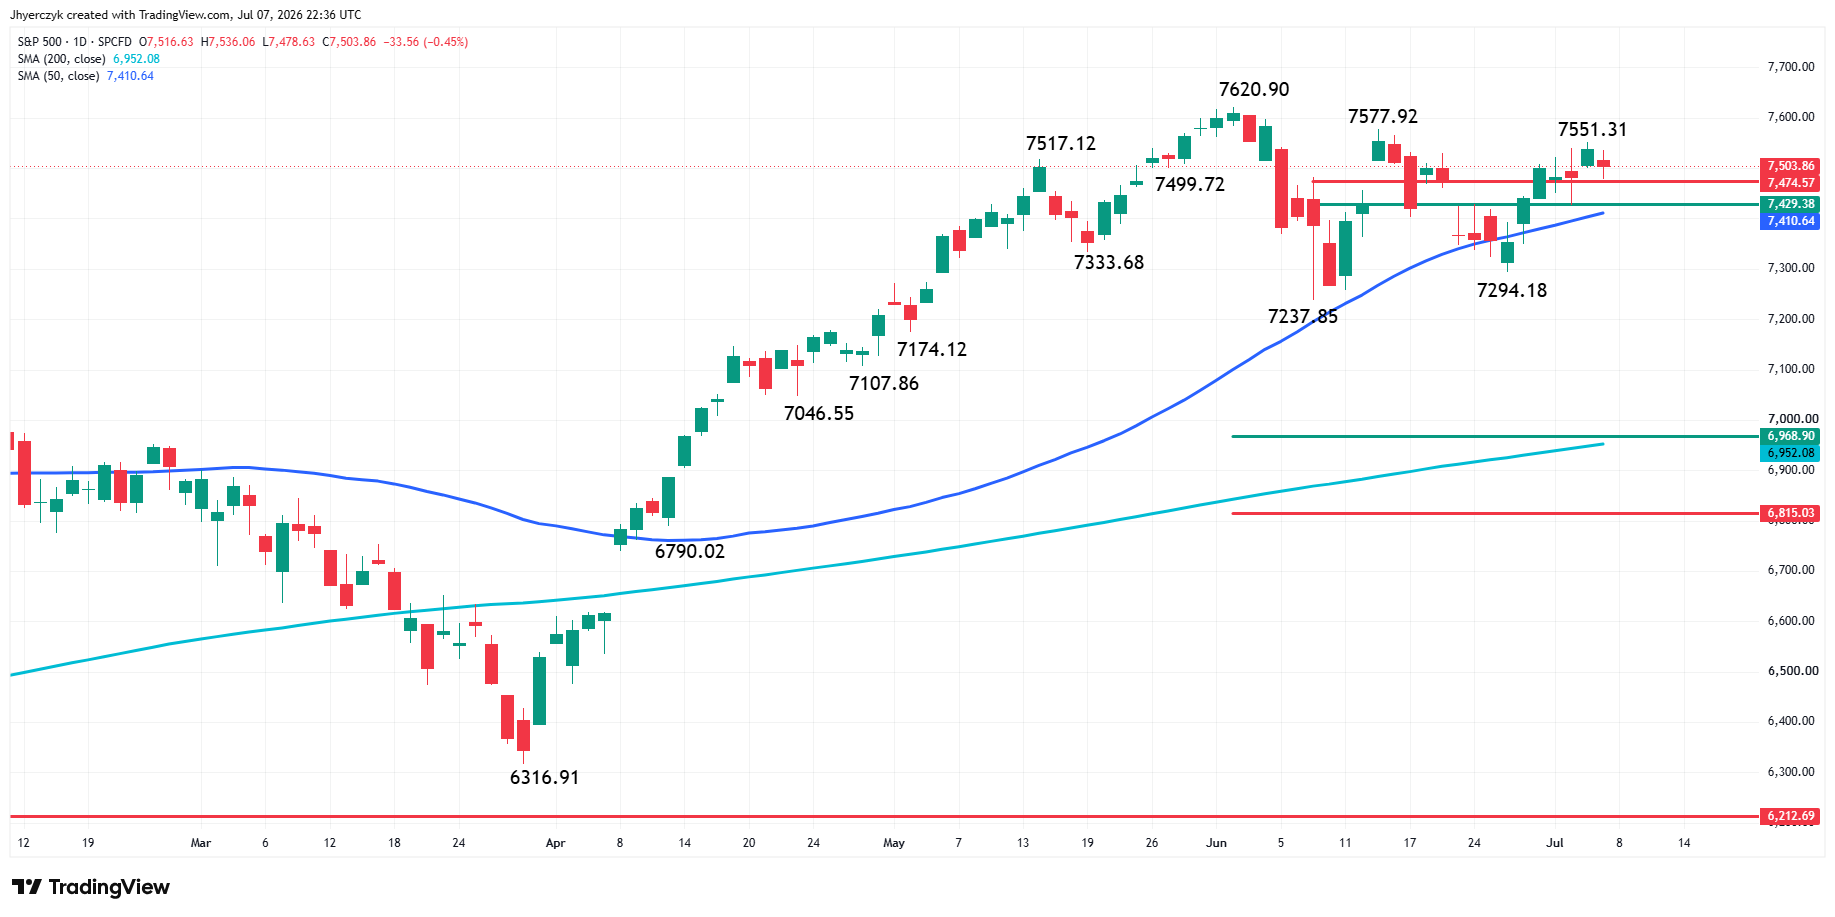
The benchmark S&P 500 Index settled lower on Tuesday. The price action formed a minor top at 7551.31, but sellers were unable to penetrate the short-term retracement zone at 7503.86 to 7429.38. More importantly, it failed to cross to the weak side of the 50-day moving average at 7410.64. This keeps the upside momentum intact for the overnight trade.
Dow Jones Price Forecast
Every new Dow Jones analysis as it publishes, today's technical signal and key levels, live price — on one page.
See all Dow Jones forecastsBullish traders are looking for the support cluster to continue to hold while they try to attract new buyers to drive the index through 7551.31 and eventually the secondary higher top at 7577.92.
Conditions could open up to the downside if the 50-day MA fails convincingly. The next two targets are swing bottoms at 7294.18 to 7237.85. The latter is a potential trigger point for an acceleration to the downside. This could put the index on a path toward the long-term retracement zone at 6968.90 to 6815.03 and the 200-day moving average at 6952.08.
Daily Dow Jones Industrial Average (DJI) Technical Analysis
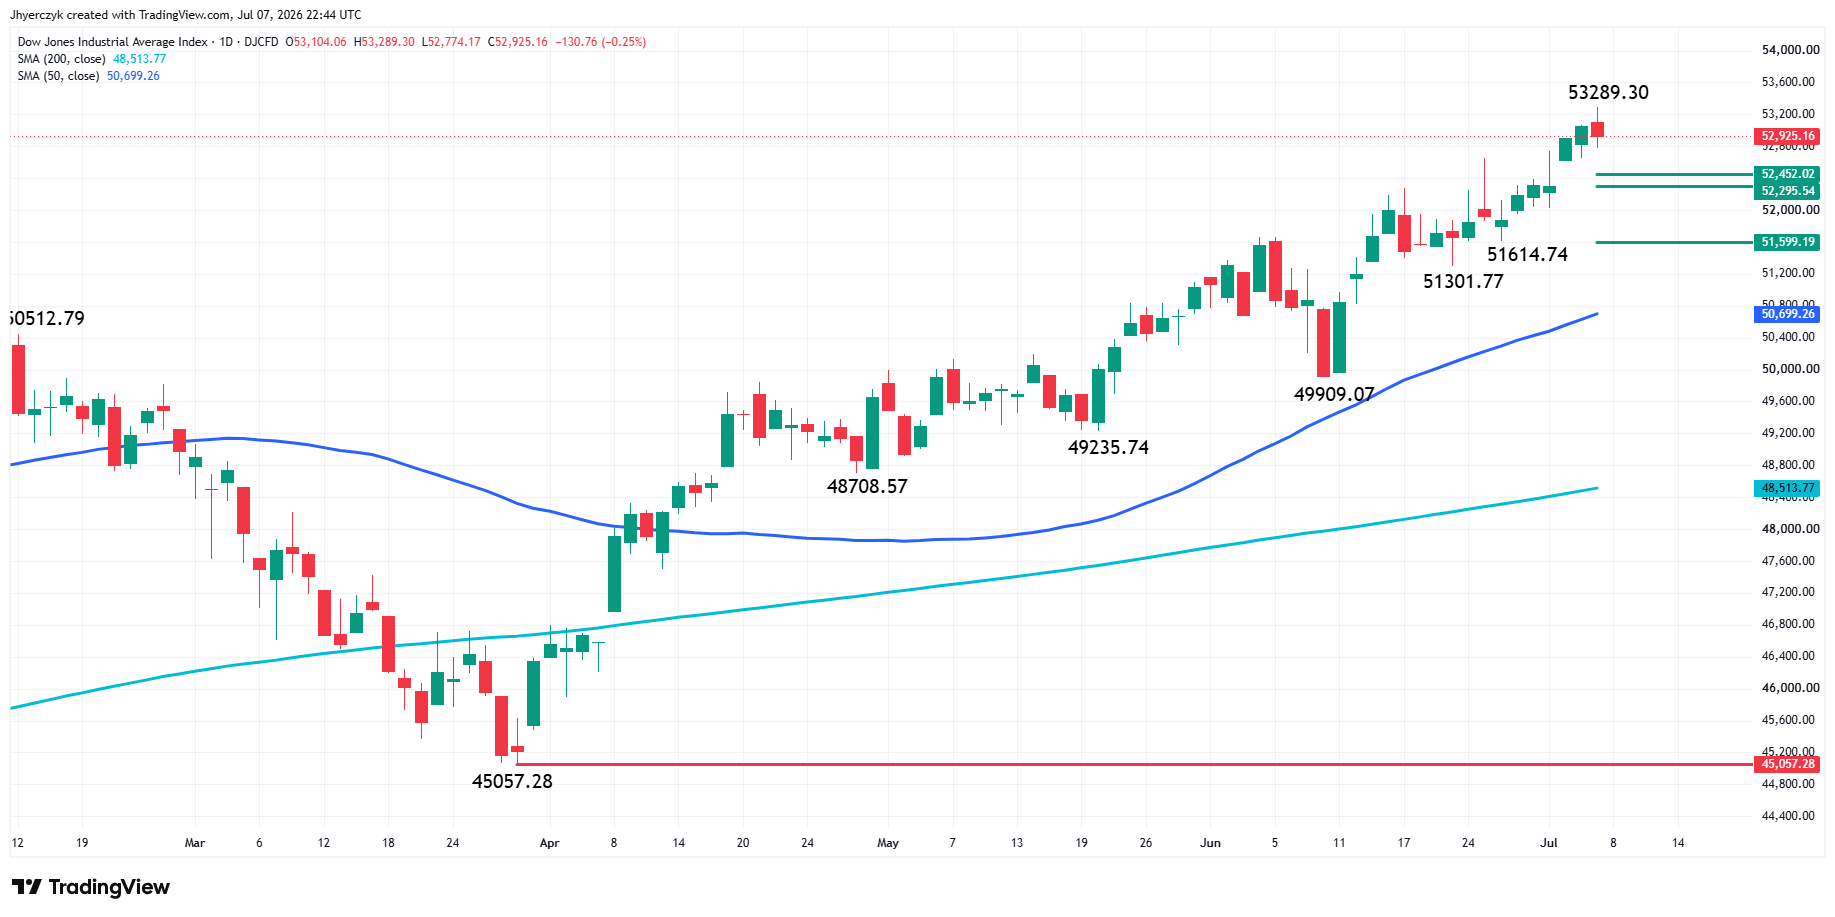
The Dow Jones Industrial Average posted a potentially bearish closing price reversal top on Tuesday. The chart pattern does not change the trend, but if confirmed, it could trigger a 2 to 3 day correction into a pair of 50% levels at 52452.02 to 52295.54.
Buyers could come in on the first test of this area, but if it fails then look for the selling to possibly extend into the 50-day moving average at 50699.26.
A trade through 53289.30 will negate the closing price reversal top, signaling a resumption of the uptrend.
Samsung Beat by 19x and the Market Sold It Anyway
Samsung Electronics reported a 19-fold increase in second-quarter operating profit and the stock dropped nearly 7% in Seoul.
“The results were in themselves fundamentally good but it seems then to have a knock-on effect at general markets that once people start being negative about Samsung, that negativity extends across markets,” said Michael Field, chief equity market strategist at Morningstar.
The Kospi fell almost 5% on the Samsung reaction before the pressure rolled through Europe and onto Wall Street. By the close the Philadelphia Semiconductor Index was down 5.5% at a four-week low.
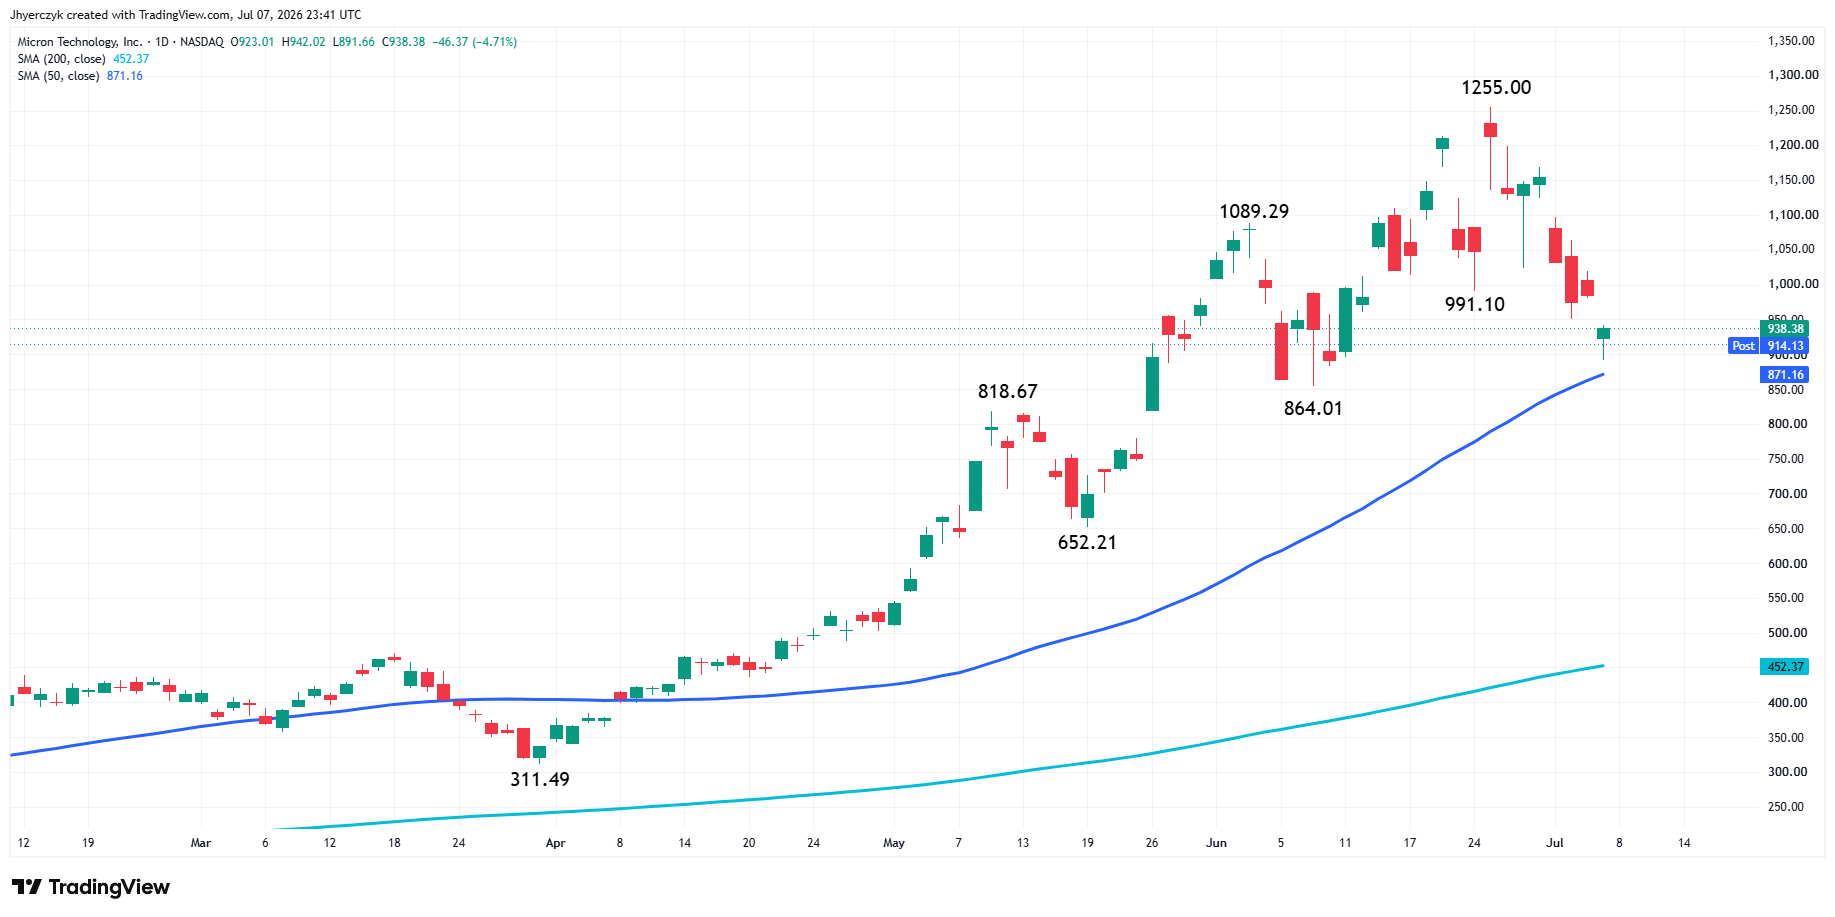
Micron Technology lost more than 4.5%. KLA, Marvell Technology, Broadcom and Advanced Micro Devices all finished sharply lower. Nvidia slipped after reports that Chinese startup DeepSeek is developing its own AI chip.
“The reaction to Samsung speaks to one of the biggest risks facing markets over the coming weeks: Q2 earnings results are likely to be quite robust on an absolute basis… but unlike with the Q1 season, expectations are presently very bullish,” wrote Adam Crisafulli of Vital Knowledge.
SK Hynix starts trading on the Nasdaq later this week. That listing is the next read on whether money comes back into the group at current prices or the sellers keep running it.
Higher Crude Piled On
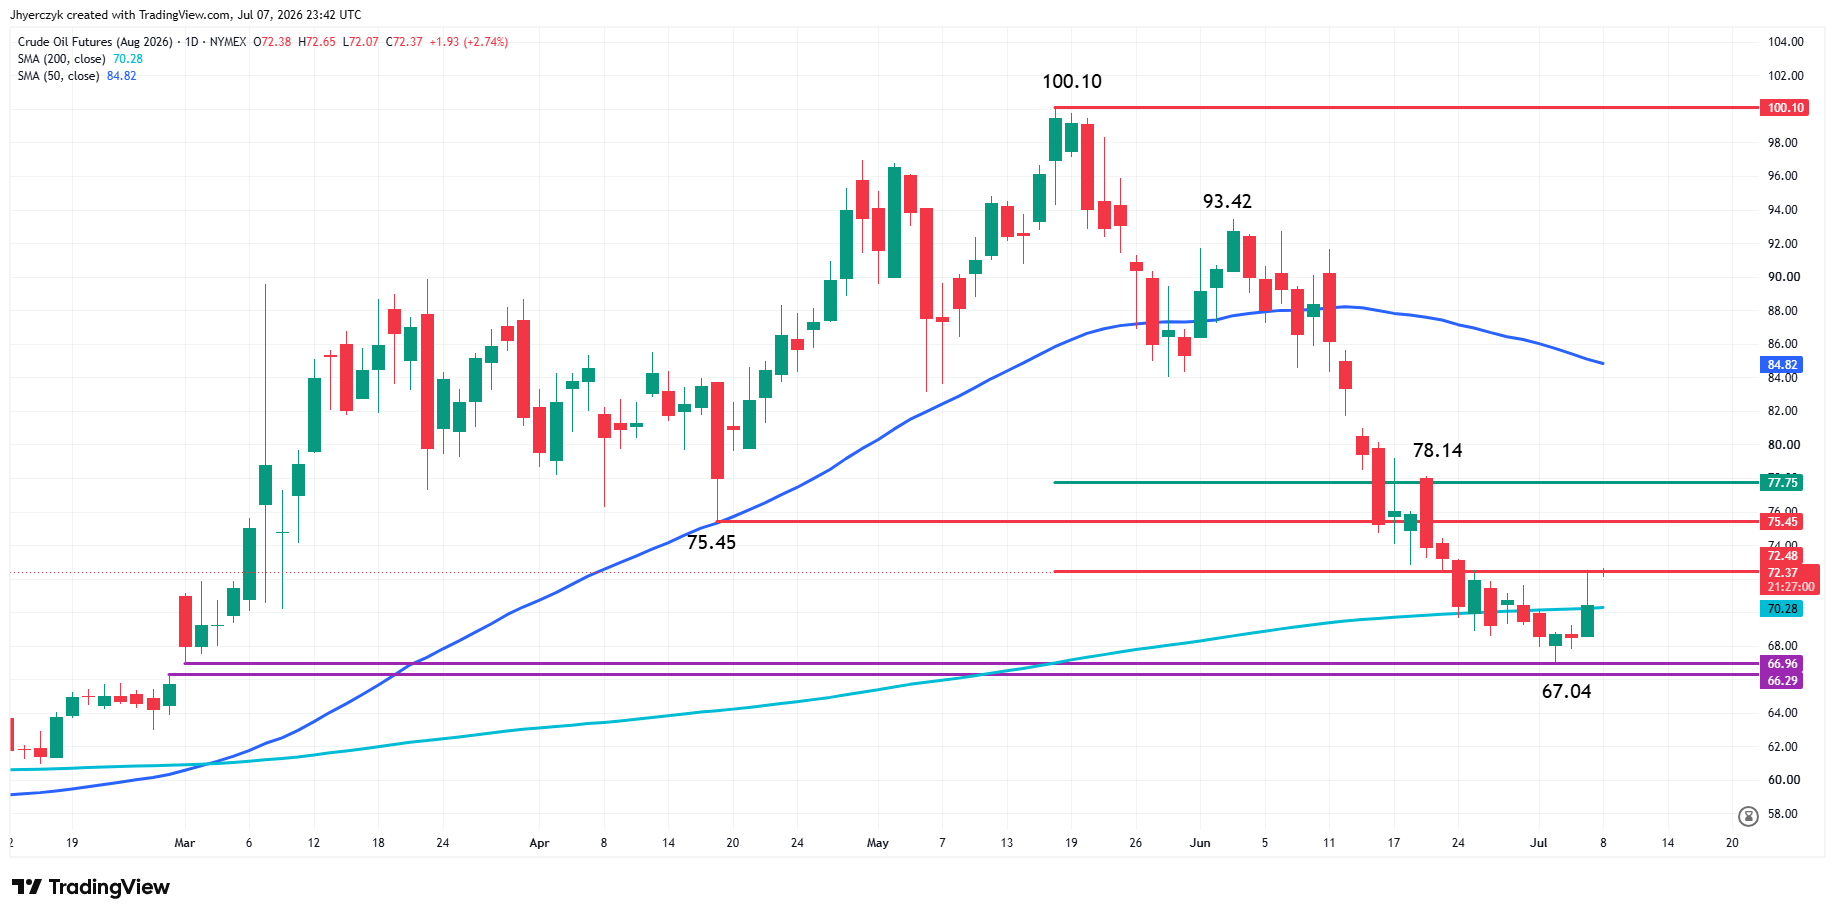
Brent crude pushed above $76 a barrel on Tuesday and West Texas Intermediate topped $72 after reports of Iranian attacks on tankers near the Strait of Hormuz. The U.S. revoked permission for Iranian oil sales and the shipping threat level in the waterway was raised to severe. Rising energy costs landing on the same session as a chip rout left the bulls with no cover.
The Rotation Picked Up Speed
“Expectations are up, and fundamentals are struggling to meet these sky-high demands, and that’s what’s fueling today’s decline,” said Mike Bailey, director of research at FBB Capital Partners. “I would expect the rotations that we’ve seen to continue.”
The money leaving semiconductor stocks stayed in equities. Eli Lilly gained about 3%. Walmart advanced after announcing price cuts on products including ground beef and Coca-Cola. JPMorgan Chase attracted buyers in financials. The trade is straightforward. Cut the names where the valuation risk is highest and move into sectors where the earnings bar sits lower. Samsung proved that even a 19-fold profit increase gets punished when forward expectations cannot satisfy the positioning already in the stock.
Stocks in the News
SpaceX dropped more than 5% on its first session as a Nasdaq-100 component despite bullish analyst coverage following the quiet period.
Rivian fell more than 13% after announcing a large stock offering.
Software names held up better than the rest of technology and a handful of fintech and telecom stocks posted gains.
What to Watch
Samsung set the tone for semiconductor earnings season and the tone is sell the beat. SK Hynix listing on the Nasdaq this week and the June FOMC minutes dropping Wednesday are the next two catalysts. Brent crude above $76 on the Hormuz attacks is adding energy cost pressure into a market already repricing the chip trade. The rotation into healthcare, staples and financials keeps building as long as semiconductor results cannot clear the expectations embedded in the stocks.
The Nasdaq closed below the 50-day moving average and the S&P 500 is still holding above its own at 7,410.64. That gap tells you Tuesday’s selling is concentrated in one sector. If the S&P 50-day fails, this stops being a rotation and becomes something broader. The Dow posted a closing price reversal top from a record high and confirmation would target a pullback into the 52,452 to 52,295 area.
More Information in our Economic Calendar.