Early Recovery Tests Short-Term Trend Support
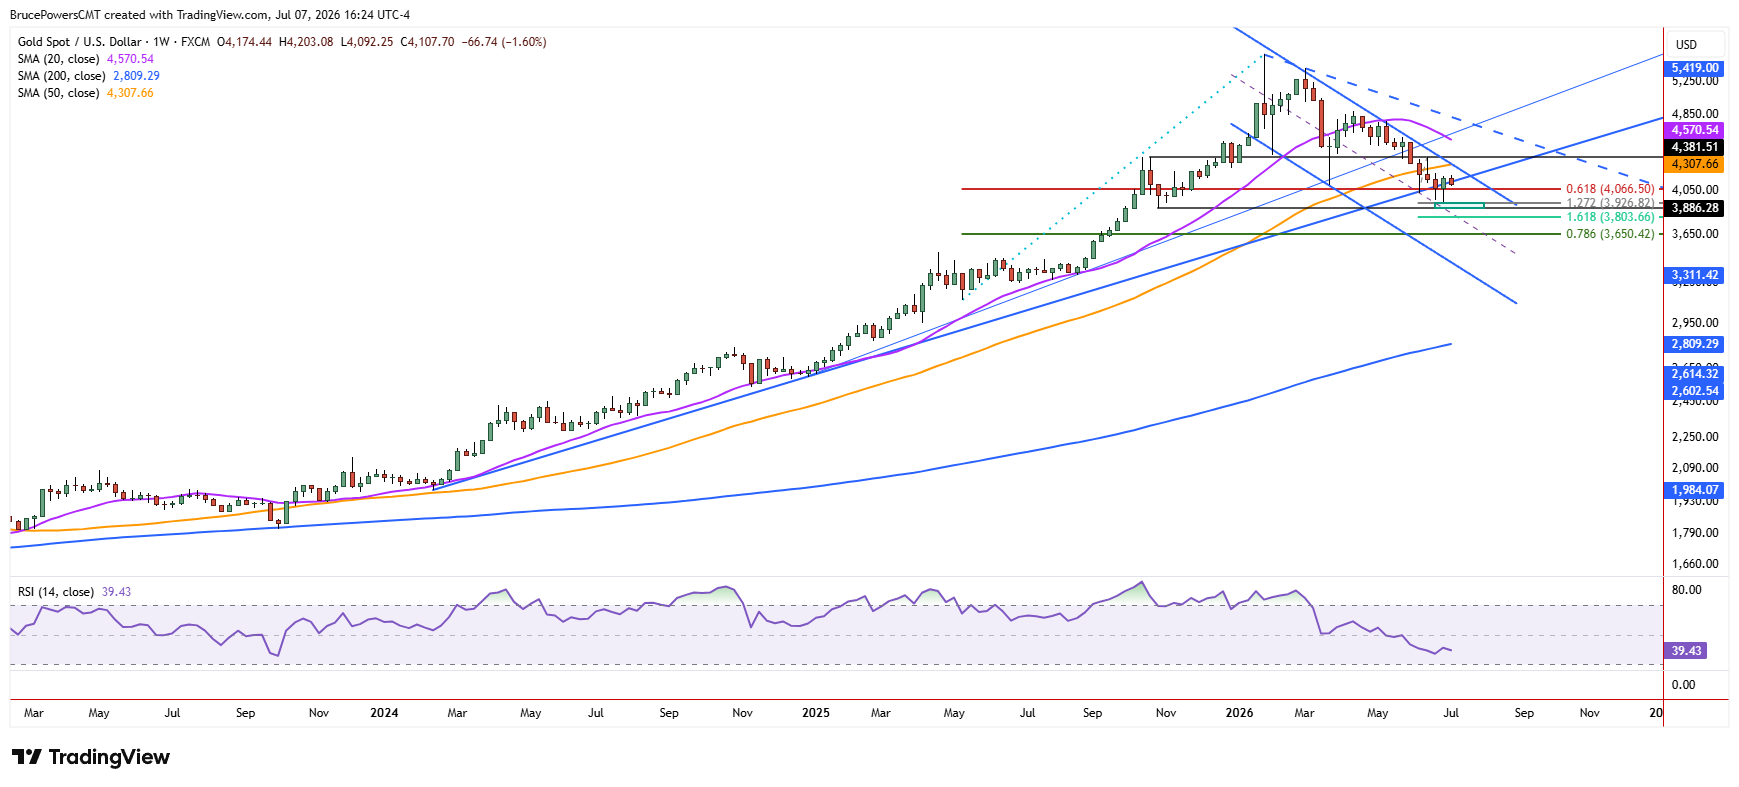
Gold continued to struggle on Tuesday as it attempted to reclaim two key trend indicators, the 20-day moving average near $4,141 and the long-term uptrend line. It closed above those indicators on Friday for the first time since mid-May and reached a slightly higher high of $4,203 on Monday. That level is a key near-term resistance level, since a decisive advance above it will trigger a bullish continuation of the developing counter-trend rally and confirm a recovery of both the 20-day moving average and the uptrend line.

A rise above $4,203 would put gold on track to test the downtrend line, along with the falling 50-day moving average. It is currently at $4,382 and aligned with the lower swing high of $4,382 from mid June. During the bearish correction, the 50-day moving average was confirmed several times as resistance and marks a key dynamic indicator for the decline. A failure to reclaim the 50-day moving average could lead to a lower swing high and another leg down in the bearish correction.

Potential Bottom Emerges After Decline
Nevertheless, there is reason to believe that last week’s new trend low of $3,942 may be the bottom for the decline. It resides near the midline of a falling channel and prior support defined by a higher swing low from October. Last week ended with a weekly bullish candlestick pattern with a high of $4,195, which means that a weekly bullish reversal signal triggered on Monday, but it did not confirm with a closing above that weekly high.
Major Resistance Determines Next Direction
Long-term dynamic resistance lies near the 50-week moving average at $4,308 and the 200-day moving average near $4,491. The 50-week moving average has converged with the downtrend line and can be watched along with the 50-day moving average for a resistance zone, since the 50-day is falling and approaching the 50-week zone. A sustained move above this resistance area would provide stronger evidence that the recent low was a durable bottom, while failure would leave the bearish structure intact.
If you’d like to know more about how to trade gold and silver, please visit our educational area.