Support Zone Sparks First Bullish Signal
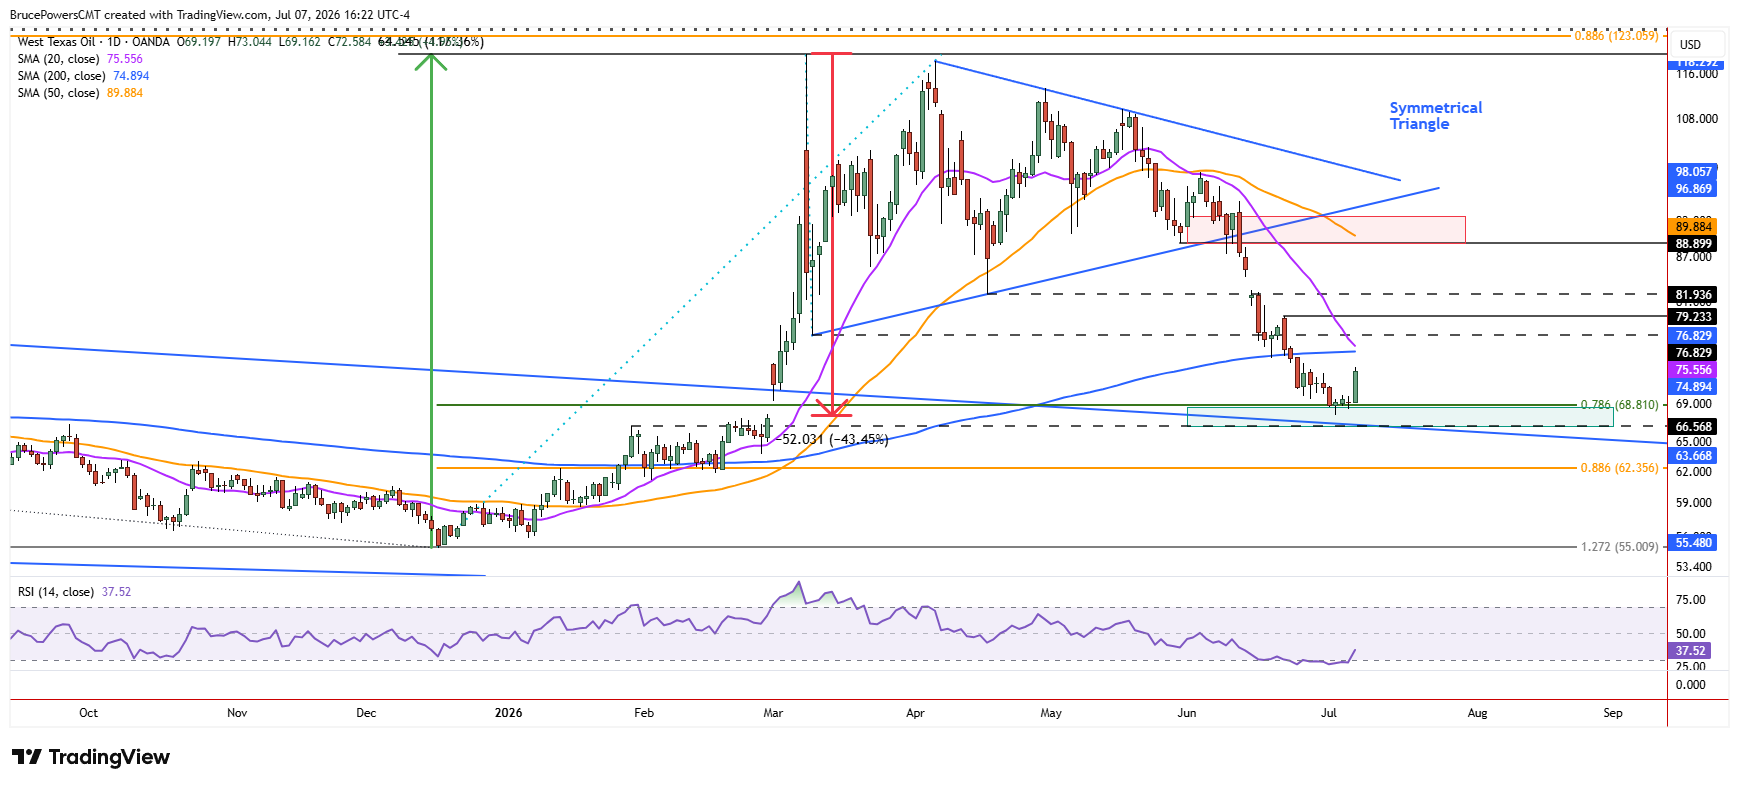
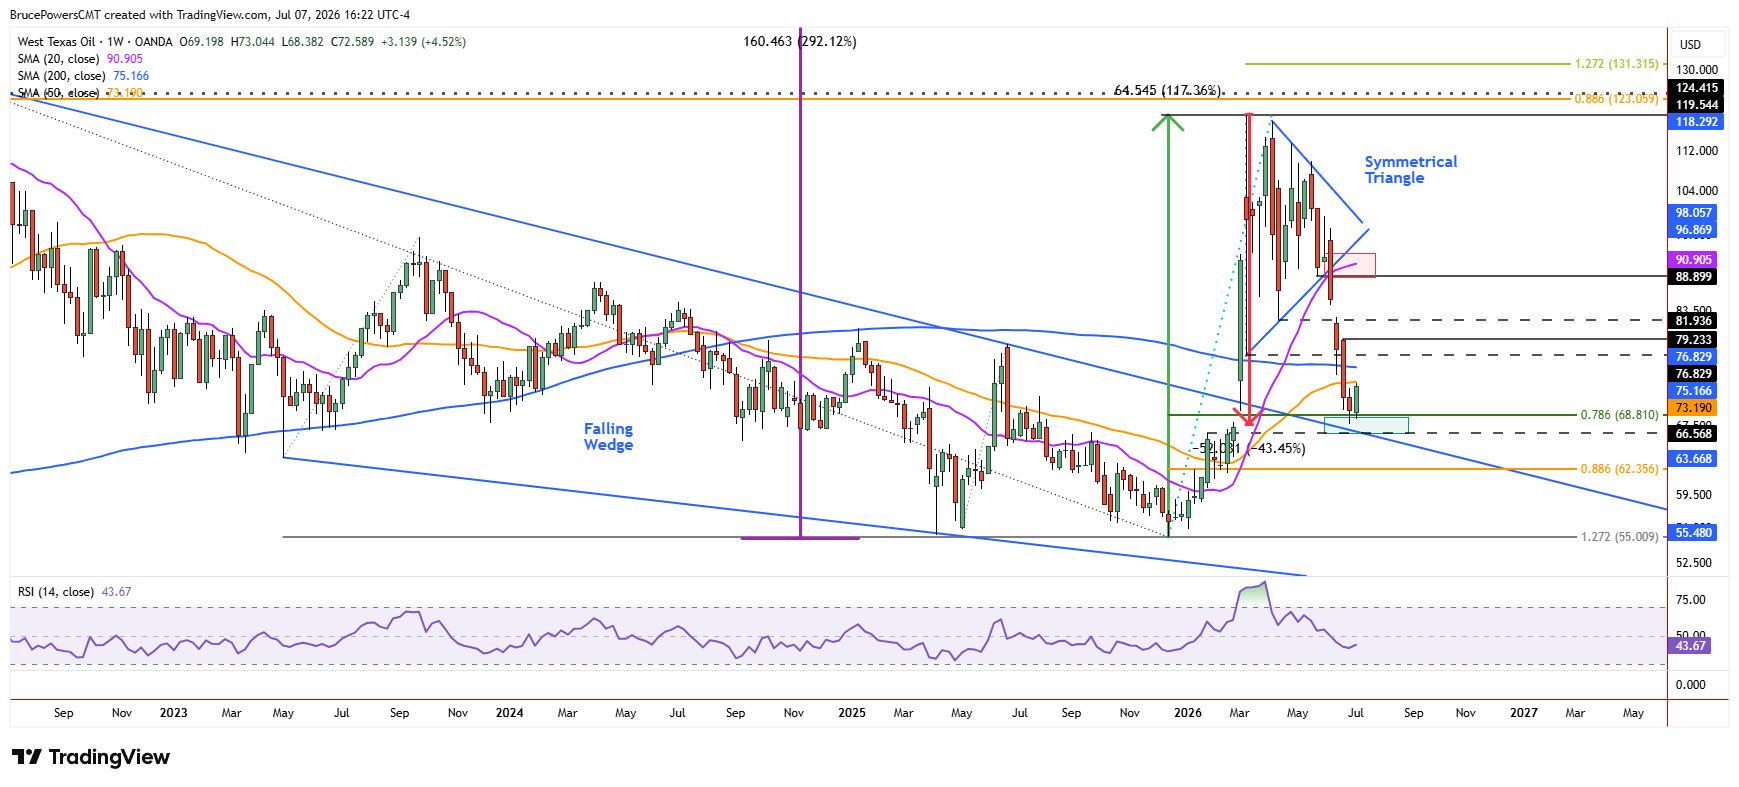
Crude oil triggered a weekly bullish reversal on Tuesday, reaching an eight-day high of $73.04, at the time of writing, after the U.S. revoked Iran’s oil sales authorization. This is the first clear bullish sign of a potential bottom for crude oil, following seven consecutive weeks of declines. Tuesday’s advance was a successful test of resistance near the 50-week moving average, after a break below it occurred two weeks ago. Given the bounce from strong support near a long-term downtrend line and the 78.6% Fibonacci retracement at $68.81, that trend indicator should soon be reclaimed.

Moving Averages Define the Recovery Path
There is also the 200-day moving average near $74.89, which may show signs of resistance. That would be the first upside target of note. A reclaim of the 200-day average may also reclaim the 20-day moving average, since it is falling from $75.55 and will soon be aligned with the 200-day moving average.
Trend Structure Points to Higher Targets
Looking at trend structure, the lower swing high of $79.23 presents a potential upside target as well. Nonetheless, the breakdown from the symmetrical triangle consolidation pattern triggered near $88.90 four weeks ago remains the key initial upside target if crude oil continues higher. At last week’s low of $67.73, the price of crude oil dropped by around 43.5% from its peak of $119.54 in March.
Reversal Needs Confirmation
As noted above, crude oil has found strength in a significant support zone and that should assist in its continued rise over the coming weeks. Nonetheless, patterns are always prone to failure until there is further evidence to show continued strength. Also, a one-week reversal doesn’t ensure that further weakness might test support before a sustained advance.
Short-Term Support Holds Key
This week’s higher weekly low is now short-term support, as a drop below it would be a sign of weakening and it could lead to a decline below the current trend low. Since the 50-week moving average is already close and the 200-day moving average is approaching quickly, those two indicators will provide the next signs of strength or weakness.
WTI Crude Oil Price Forecast
Every new WTI Crude Oil analysis as it publishes, today's technical signal and key levels, live price — on one page.
See all WTI Crude Oil forecastsIf you’d like to know more about how commodity markets work, please visit our educational area.