Major Support Zone Sparks Bullish Reversal
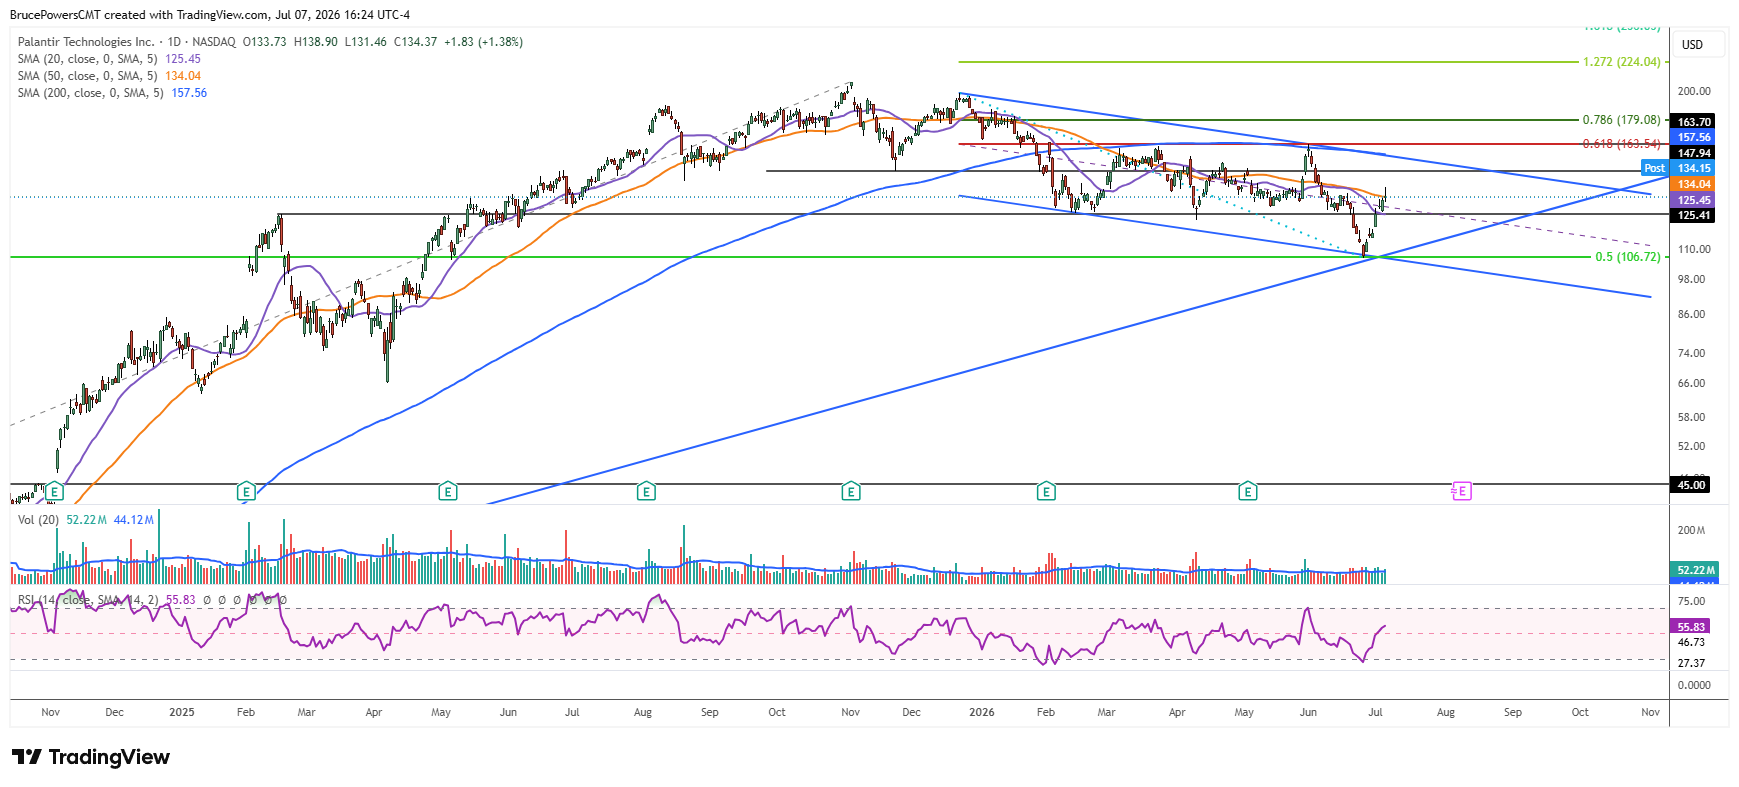
The stock of data software company Palantir Technologies, Inc. (PLTR) looks like it may have found a bottom to its bearish correction following a low of $106.37 established two weeks ago. That low occurred at the confluence of several indicators, reinforcing a significant support zone. A 50% retracement of the full advance that began from the December 2022 low came in at $106.72, while the convergence of a rising trendline and the lower boundary of a descending trend channel further strengthened that area as support.
A sharp rally followed, confirming buyers responded aggressively at that support zone and triggering a bullish reversal. This put PLTR on track to eventually test resistance near the top boundary line of the descending channel, along with the 200-day moving average, currently at $157.57 and falling. The short-term trend improved further on Tuesday with a decisive reclaim of the 50-day moving average at $134.09, marking the first move back above that indicator since it failed to hold as support on June 5. The next price level of note is the November 2025 swing low at $147.56. That low had previously defined support within a head and shoulders topping pattern.

Bullish Flag Sets the Bigger Picture
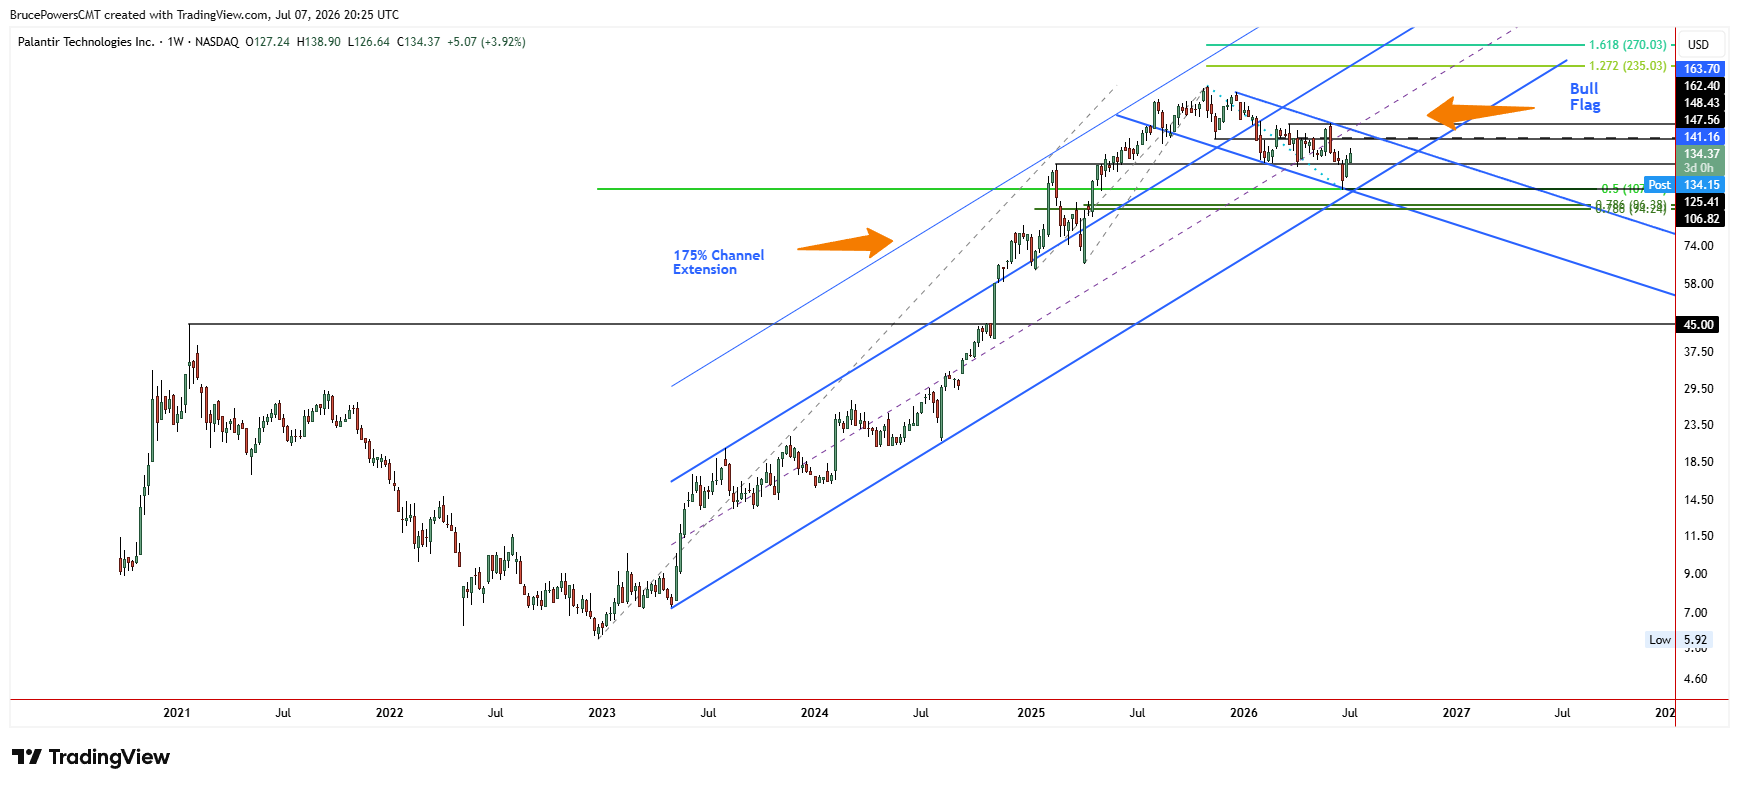
The long-term trend structure as seen in the weekly chart shows the potential formation of a large bullish flag. If last month’s low marks the bottom of the correction, an eventual upside breakout of the parallel channel forming the flag would signal a continuation of the larger bullish trend. The 200-day moving average remains a key dynamic resistance indicator because it was confirmed several times as resistance following the break below it in late January.
Beyond that, the lower swing high that defines the bearish trend structure is a key upside target, as a rally above that level would signal that the declining channel has likely been reversed. That price zone carries additional weight because it aligns closely with a 61.8% Fibonacci retracement of the bearish correction.
Support Levels Hold the Key
In the short-term, PLTR is extended. However, if the recent low ultimately proves to be the lasting bottom of the correction, pullbacks should be watched closely for signs that they are completing and for renewed evidence of buying strength. The 50-day moving average at $134.09 is one area to watch for support, followed by the 20-day moving average near $125.60.
In addition, the former high from February 2025 at $125.41 marks another potential support zone, aligning closely with this week’s low of $126.64. How PLTR behaves around these support levels could provide the next clue as to whether the developing bullish reversal has enough momentum to continue toward resistance targets.
If you’d like to know more about technical analysis and how traders use it, please visit our educational area.