NASDAQ 100 Technical Analysis
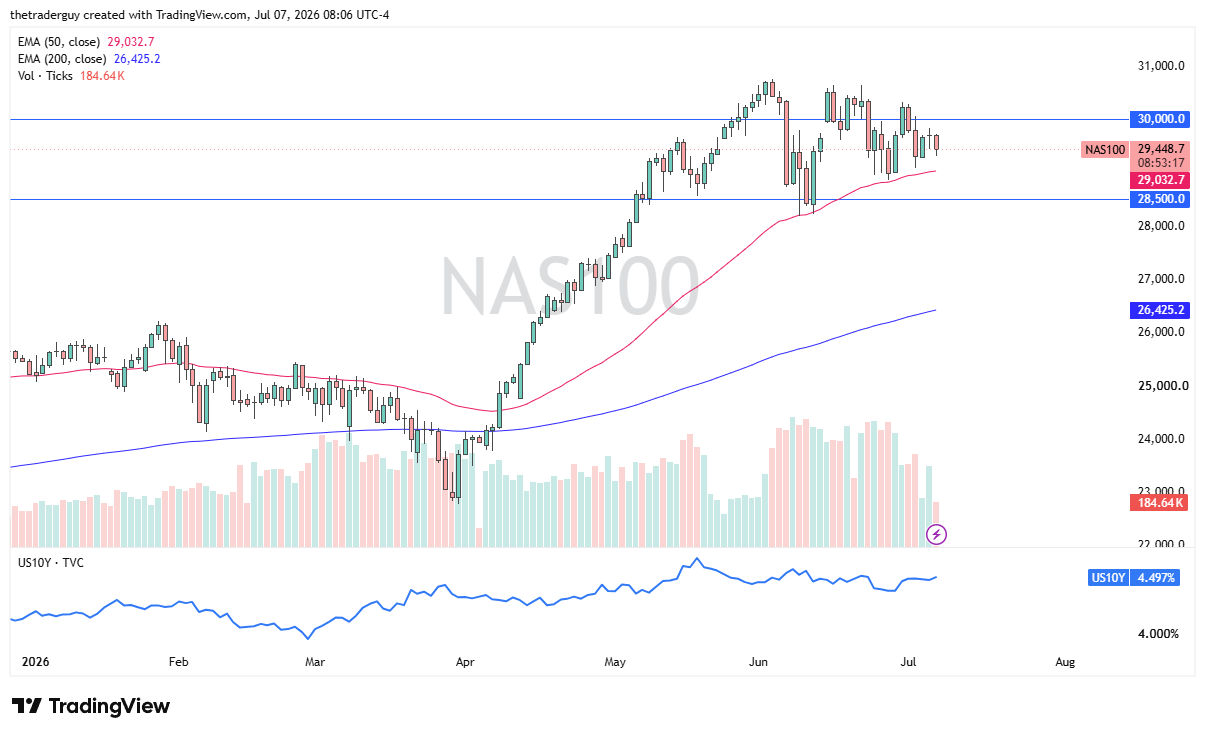
The Nasdaq 100 fell a bit during the early part of the trading session here on Tuesday, but in premarket trading, we do see a little bit of an attempt to push this thing back to the upside. All things being equal, the US stock markets are very positive from a longer-term standpoint, and I believe it is probably only a matter of time before the buyers come back, but we have to watch this 50-day EMA as it could offer a bit of support underneath as a signal that buyers are, in fact, defending. If we can break above the 30,000 level, then it’s possible that we have higher to go as well.

Dow Jones 30 Technical Analysis
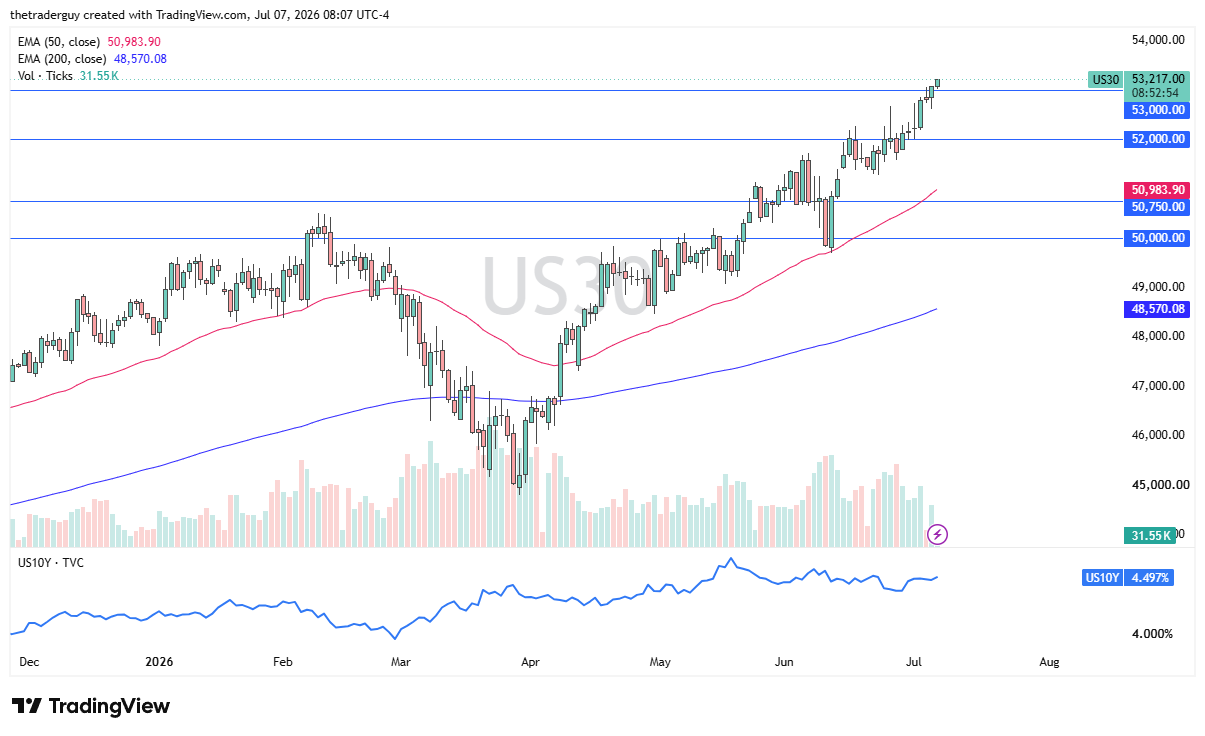
The Dow Jones 30 looks very strong again as we are now above the 53,000 level and clearly looking very bullish at this point. Ultimately, I think this is a market that continues to see a lot of short-term buying pressure every time the sellers come back. Ultimately, the 53,000 level will have a certain amount of psychology attached to it; I think it could offer support, but even if the market were to break down below there, the trend is still very much intact.
S&P 500 Technical Analysis
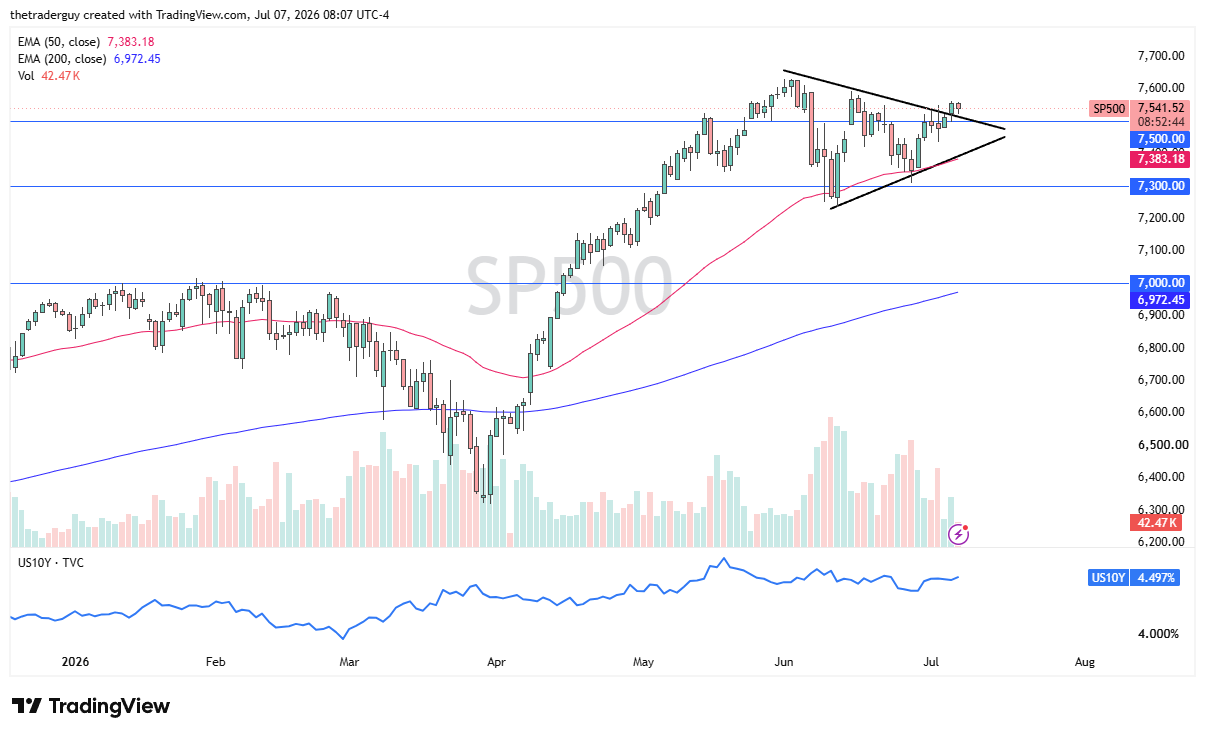
The S&P 500 initially fell in early trading but has bounced from the previous trendline of the symmetrical triangle. The 7,500 level is an area that looks very much like it is trying to show signs of life there. The S&P 500 continues to be very noisy and is forming a bit of a W-pattern, so that is another thing that may give a bit of comfort to the bulls. I have no interest in shorting any of these markets.
NASDAQ 100 Price Forecast
Every new NASDAQ 100 analysis as it publishes, today's technical signal and key levels, live price — on one page.
See all NASDAQ 100 forecastsIf you’d like to know more about chart patterns and how to trade them, please visit our educational area.