Former Resistance Sets the Stage
When looking at the historical price action of Twilio Inc. (TWLO), it is notable how well the stock ahs respected key price levels and repeated recognizable patterns. The company provides a customer-engagement platform for businesses and resides in the software sector. Arrows on the weekly chart highlight examples where earlier support or resistance levels were recognized later as the trend progressed. This characteristic of TWLO can add confidence when evaluating future technical signals, particularly when former resistance transitions into support – a behavior now being tested again.
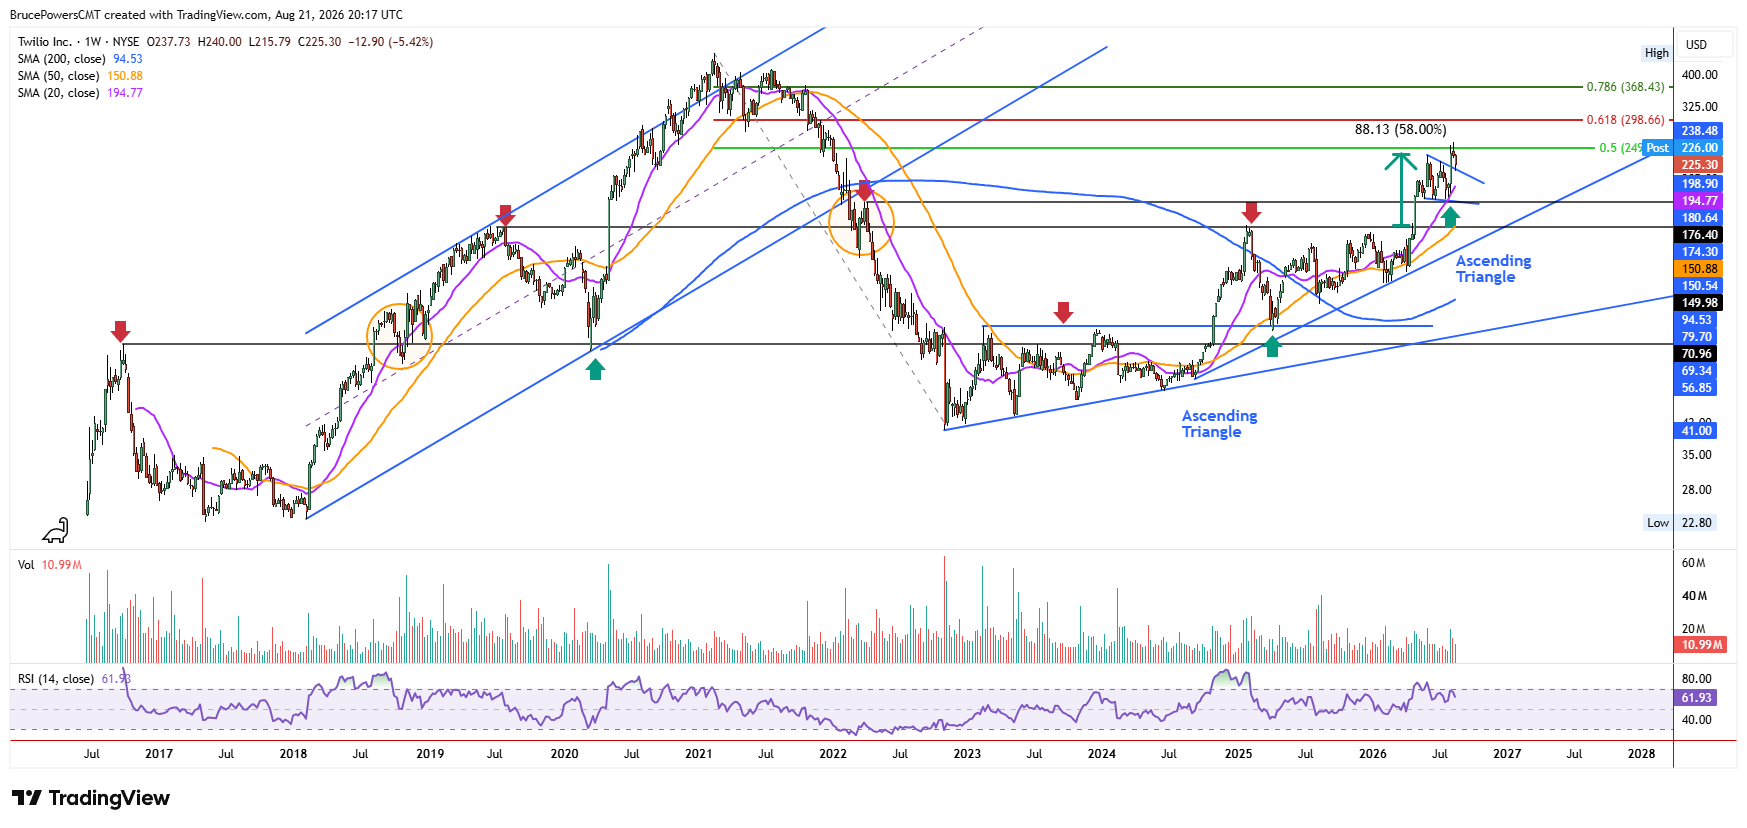
Most recently, the 2019 high of $150.44 was recognized as a key resistance zone beginning in January 2025, resulting in the formation of an ascending triangle pattern. That pattern was essentially a repeat of an earlier consolidation phase that also resulted in an ascending triangle. The first pullback following the upside breakout of that earlier triangle confirmed the switch from resistance to support at the top of the pattern. Once that switch was confirmed, the bull trend continued with dynamic support defined by the rising 50-week moving average.

Breakout Signals Stronger Demand
An upside breakout of the recent ascending triangle occurred at the beginning of May followed Twilio’s Q1 2026 earnings report. A gap-up open confirmed the pattern breakout, with TWLO eventually reaching a high of $238.48 before entering a pullback. The first pullback following the triangle breakout, however, did not retest support near the former resistance zone at the top of the triangle. Instead, buyers were more aggressive than during the prior pattern, and the pullback was relatively shallow. Support was found at the higher price of $179.65. Nonetheless, that zone corresponded with previous resistance at a minor lower swing high from March 2022. Dynamic support was also confirmed near the 20-week moving average during the pullback.
Bull Flag Breakout Meets First Support Test
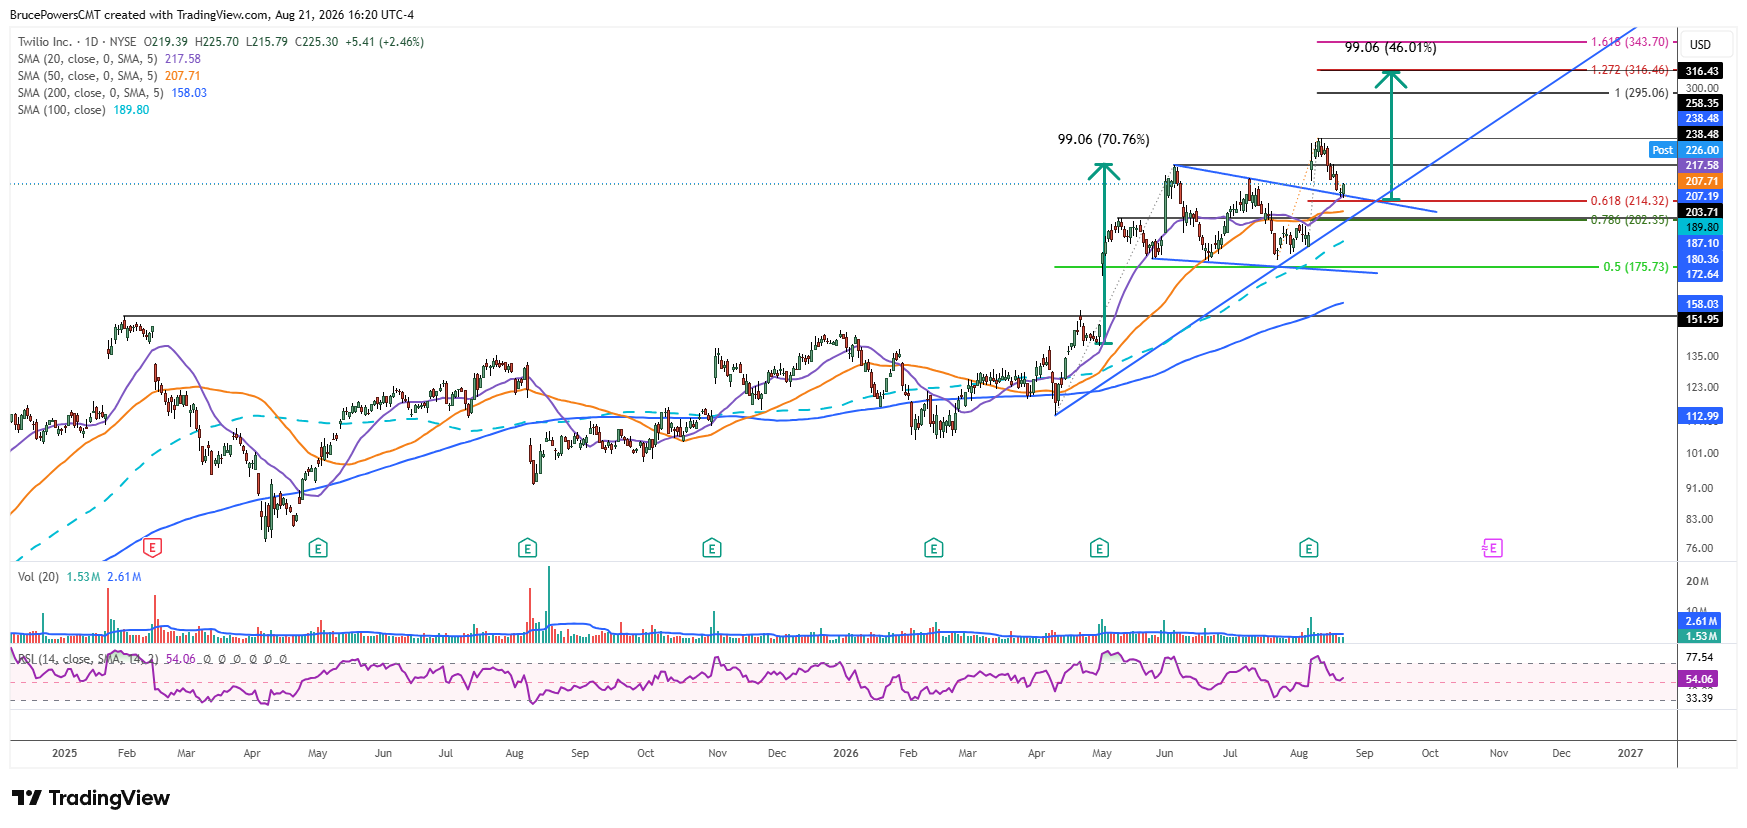
A bullish flag pattern formed following the June high and a breakout of the pattern triggered two weeks ago after Q2 2026 earnings were reported, eventually driving TWLO to a new high of $258.35 last week. TWLO is now in its first pullback following the bullish flag breakout, reaching a low of $215.79 on Friday. This area therefore represents the first potential key pivot zone where buyers could re-emerge, and trigger renewed signs of strength and a second leg up following the flag breakout.
Key Support Zone Comes Into Focus
The low of the pullback is testing support at the prior resistance zone defined by the downtrend line across the top of the triangle. This is classic bullish behavior if support holds and is followed by renewed upside momentum. Further, the 20-day moving average at $217.38 and the 61.8% Fibonacci retracement at $214.32 strengthen the potential for the zone to hold as support and complete the first pullback after a significant bullish trend continuation signal. Given TWLO’s history of former resistance becoming support, a successful defense of this zone would reinforce that bullish behavior.