Trend Support Holds as Resistance Looms
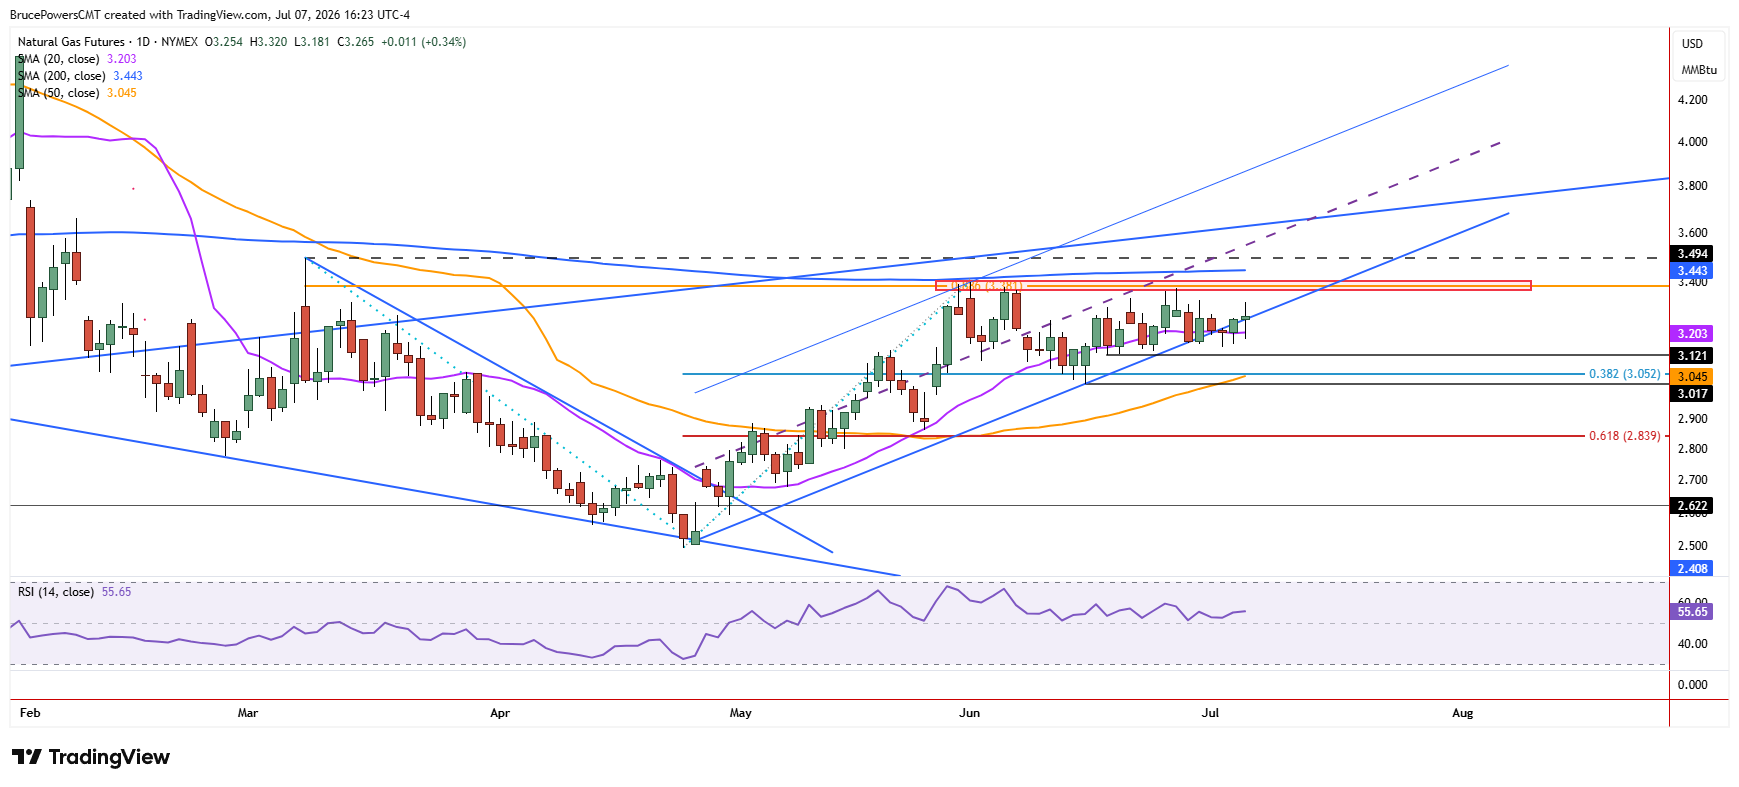
Natural gas advanced to a four-day high of $3.32 on Tuesday and is set to close again above the 20-day moving average, retaining a key area of trend support. Nonetheless, until natural gas rises above the lower swing high at $3.36, it remains under pressure and at risk of breaking lower. Even so, a rise above that level hits a resistance zone up the trend high of $3.40, and a breakout above that level quickly reaches the 200-day moving average near $3.44.
Long-Term Breakout
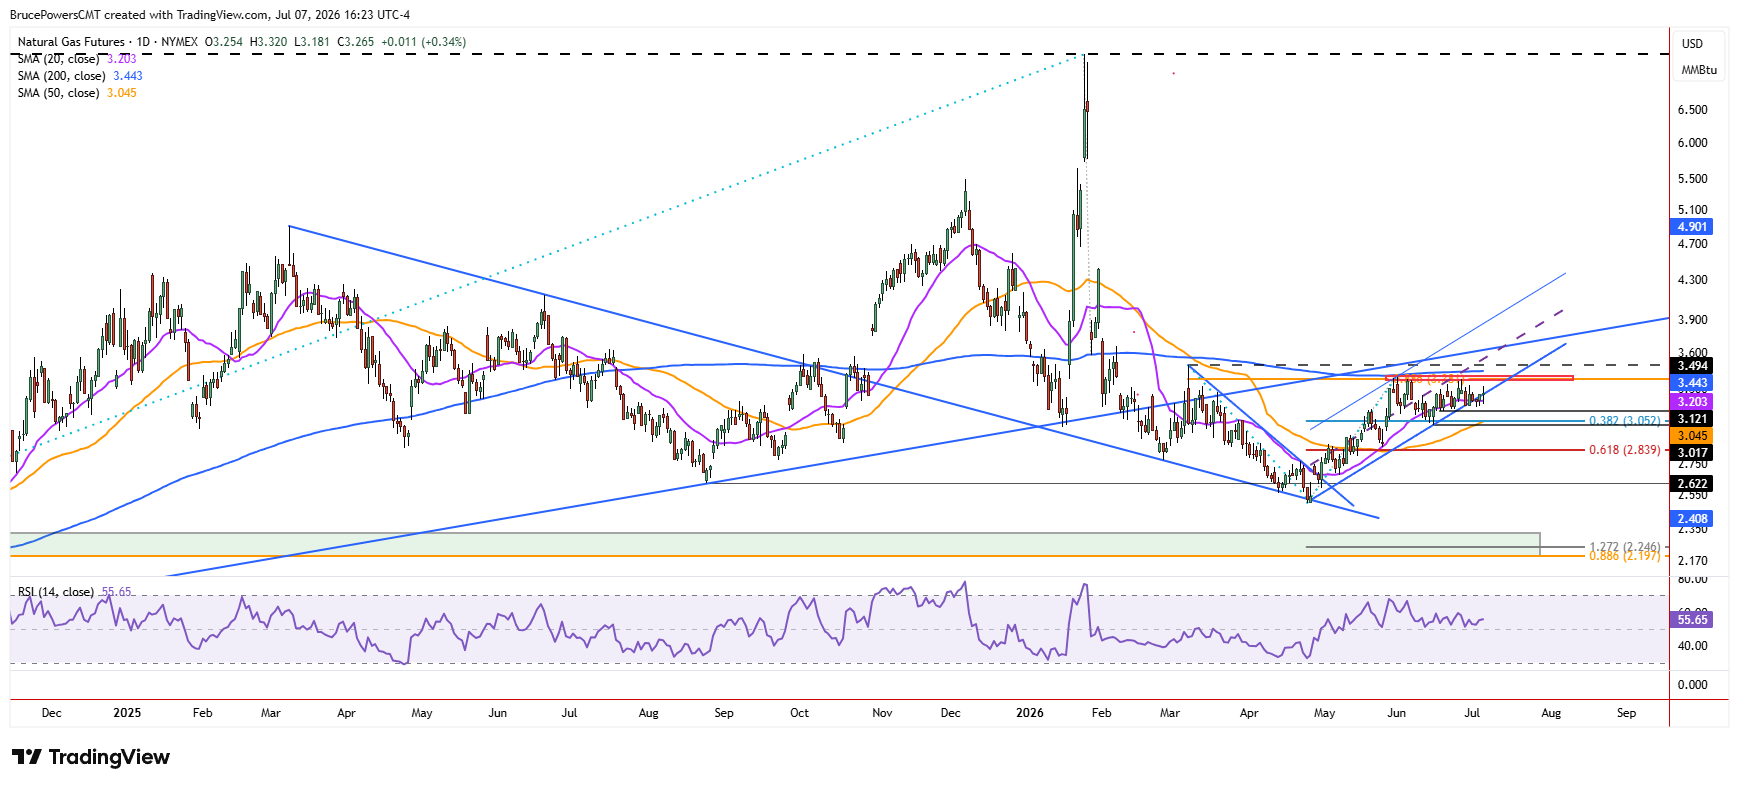
Since natural gas has retained the near-term uptrend and continues to suggest additional testing of resistance, that strength could lead to a reclaim of the 200-day moving average. The last time natural gas was above it was in early February. So, a reclaim of the long-term resistance indicator would show a change of character, as a buyers may then start to get more aggressive. However, a bullish reversal of structure would confirm the advance of the developing uptrend and a reversal signal or the prior downtrend. That would suggest a bullish continuation to likely follow.
Key Support Levels Define Downside Risk
Otherwise, consolidation could continue to develop and possible weaken towards a test of support near the recent higher swing low of $3.02. But since the 50-day moving average has risen above that low, it takes precedence as dynamic support. Therefore, if support near $3.12 is broken, the 50-day line, now near $3.05, becomes a target.
Range Compression Signals Potential Expansion
What is now becoming clearer is the continuation of range compression, which may be more apparent in the weekly chart. Although this week is not complete, the current weekly pattern is of a double inside week. The range of this week, so far, is contained within last week’s range and the range of last week fits inside the range before it. Range compression may be followed by range expansion and, therefore, momentum moves. This would suggest that although volatility is low, that could change soon.
If you’d like to know more about how to trade natural gas, please visit our educational area.