Solana (SOL) has booked a 27% gain in the past month alone after bouncing off the $60 threshold.
This makes Solana the best-performing altcoin during this period and has helped it trim its year-to-date losses to levels that are much more similar to the rest of the tokens in its category.
For weeks, SOL was one of the most battered assets in top 5, as it YTD losses stood at 50%. Now, most altcoins are in the same range during this time frame, with a 30% retreat in 2026.
The latest price action shows that investors have been accumulating the token at $80 following an encouraging resistance breakout that could set the stage for a stronger uptick.
Trading volumes have jumped by 44% in the past 24 hours as SOL has seen its price increase by nearly 2% to $82.
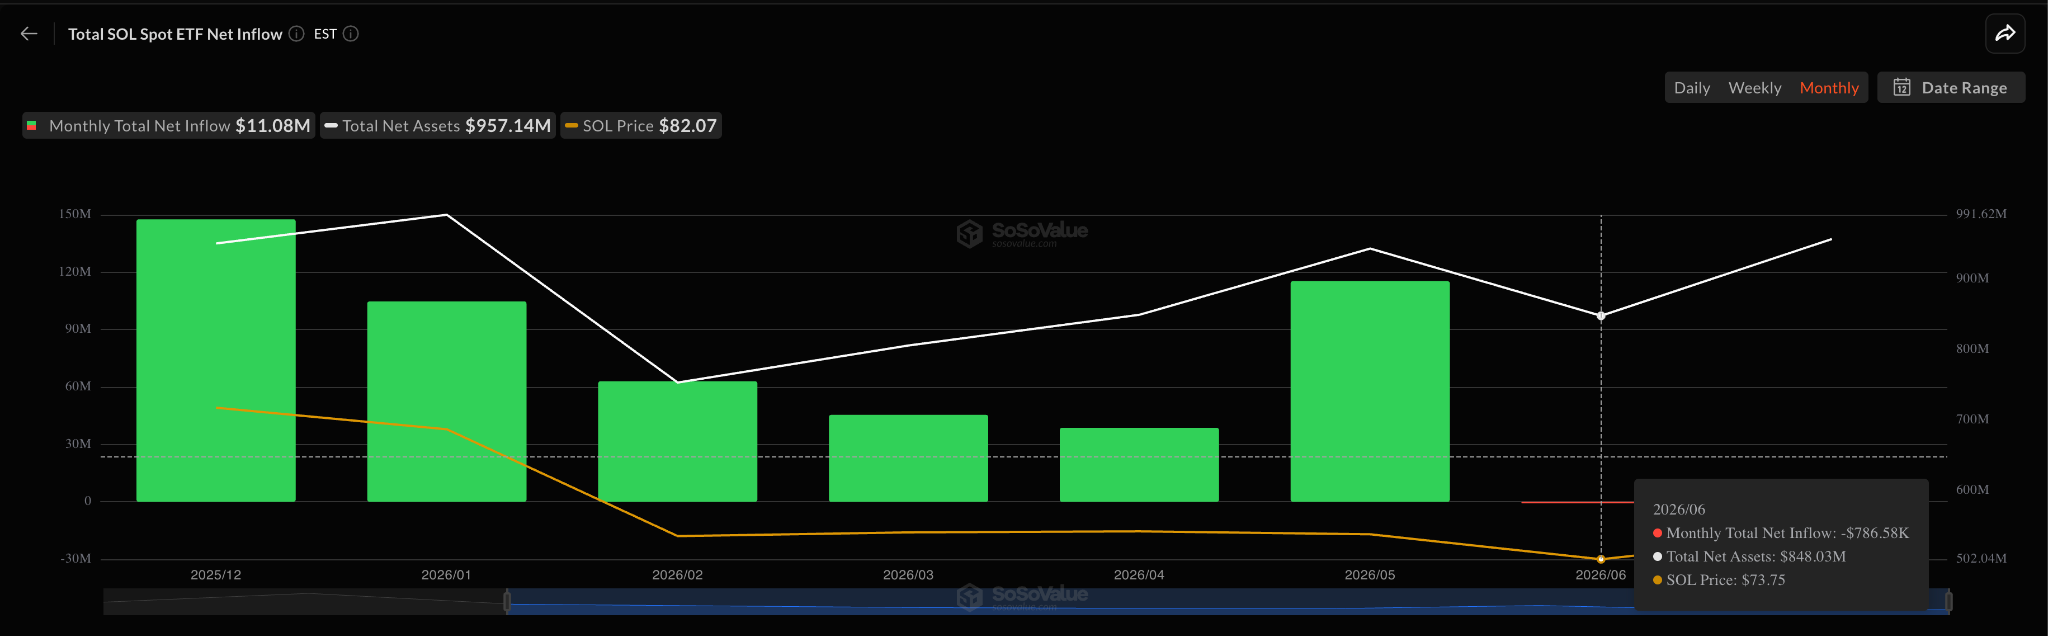
Last month, net inflows to exchange-traded funds (ETFs) linked to Solana dried up, as investors pulled out around $1 million from these vehicles. This marked a significant depature from May’s $115 million net inflows.
During the first 6 days of this month, SOL ETFs have already received $11 million in net inflows, highlighting that Wall Street investors could be getting ready to scoop up the token once again at its current price.

Weekly Transactions Hit a New Record at 1 Billion
On-chain data shows that the Solana blockchain hit a milestone after processing 1 billion transactions last week for the first time in its history. This could be the result of higher micro-payment volumes.
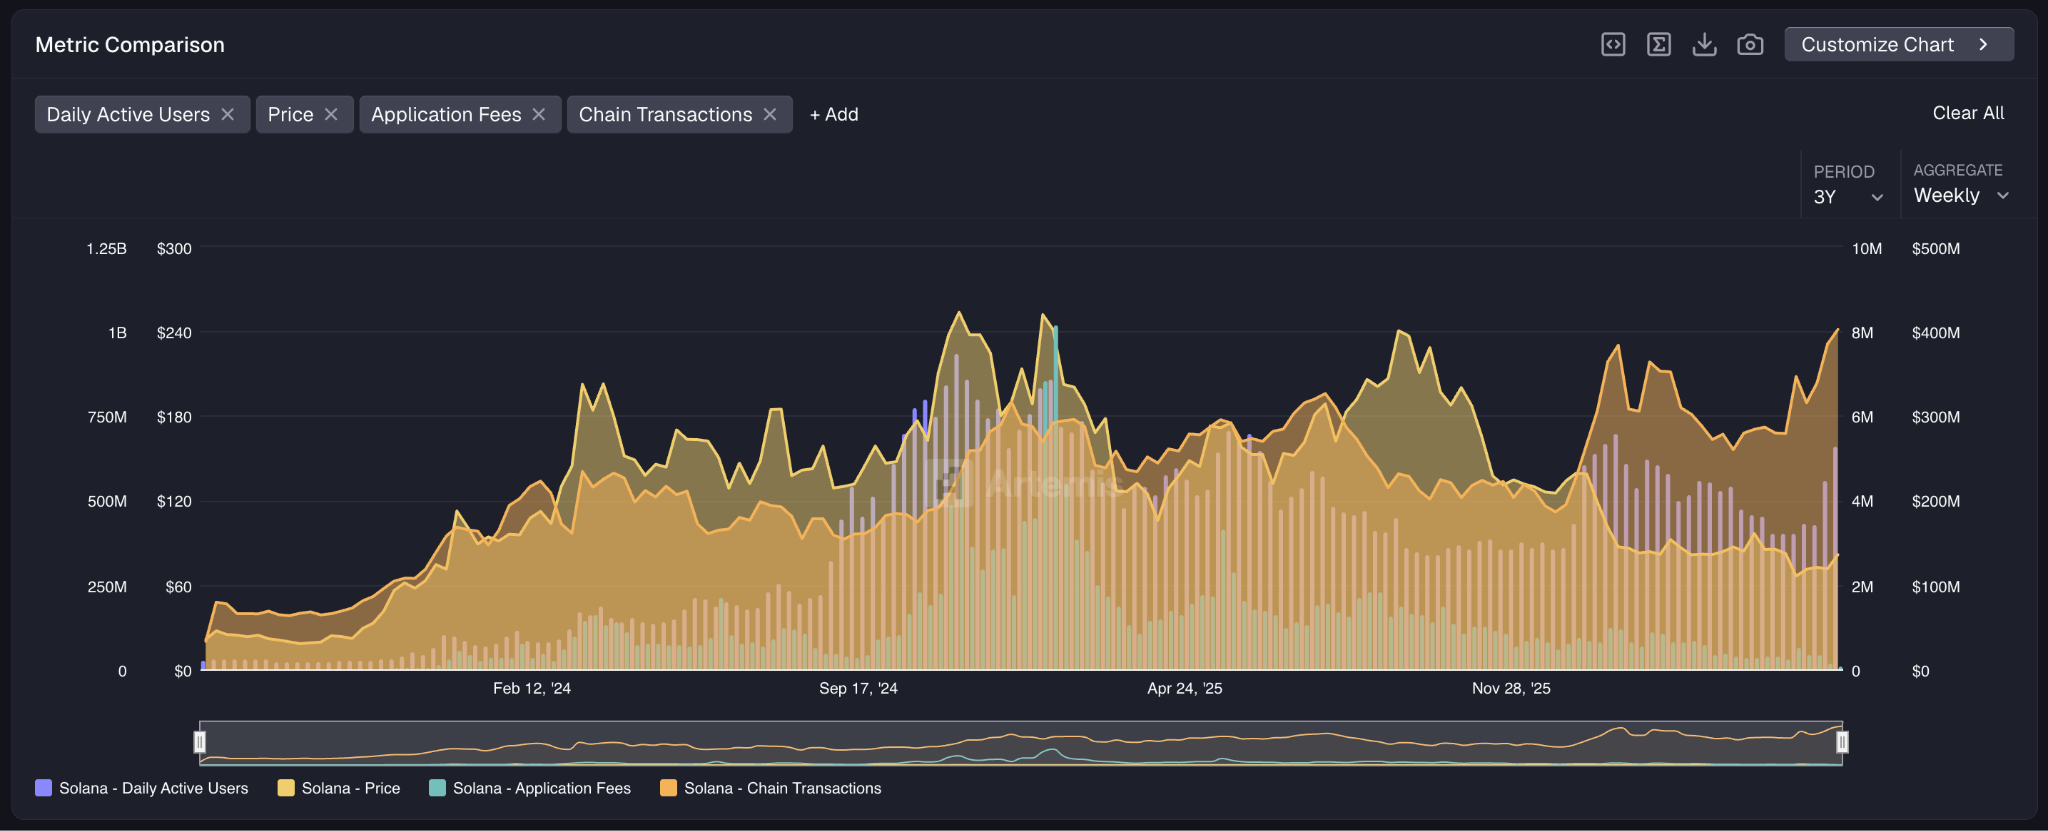
Sadly, this is not a positive indication in terms of ecosystem growth, as application fees closed last week at their lowest levels since December 2023.
Solana-based decentralized apps brought in only $5.8 million in fees during this period, meaning an 89% drop from their 2026 weekly peak during the first week of February and down 98.5% from their all-time high at January 2025, back when President Donald Trump’s meme coin was launched.
Meanwhile, weekly active users spiked to 5.3 million last week, meaning an 18% jump compared to the week before. This could be an indication of higher interest in SOL at a point when the price action flashed a buy signal.
Solana Price Forecast
Every new Solana analysis as it publishes, today's technical signal and key levels, live price — on one page.
See all Solana forecastsSolana (SOL) Could Rise to $96 After Key Resistance Breakout
Heading to the daily chart, we can see that the price broke an ascending triangle pattern and prevented a triple top from forming at $75 last week.
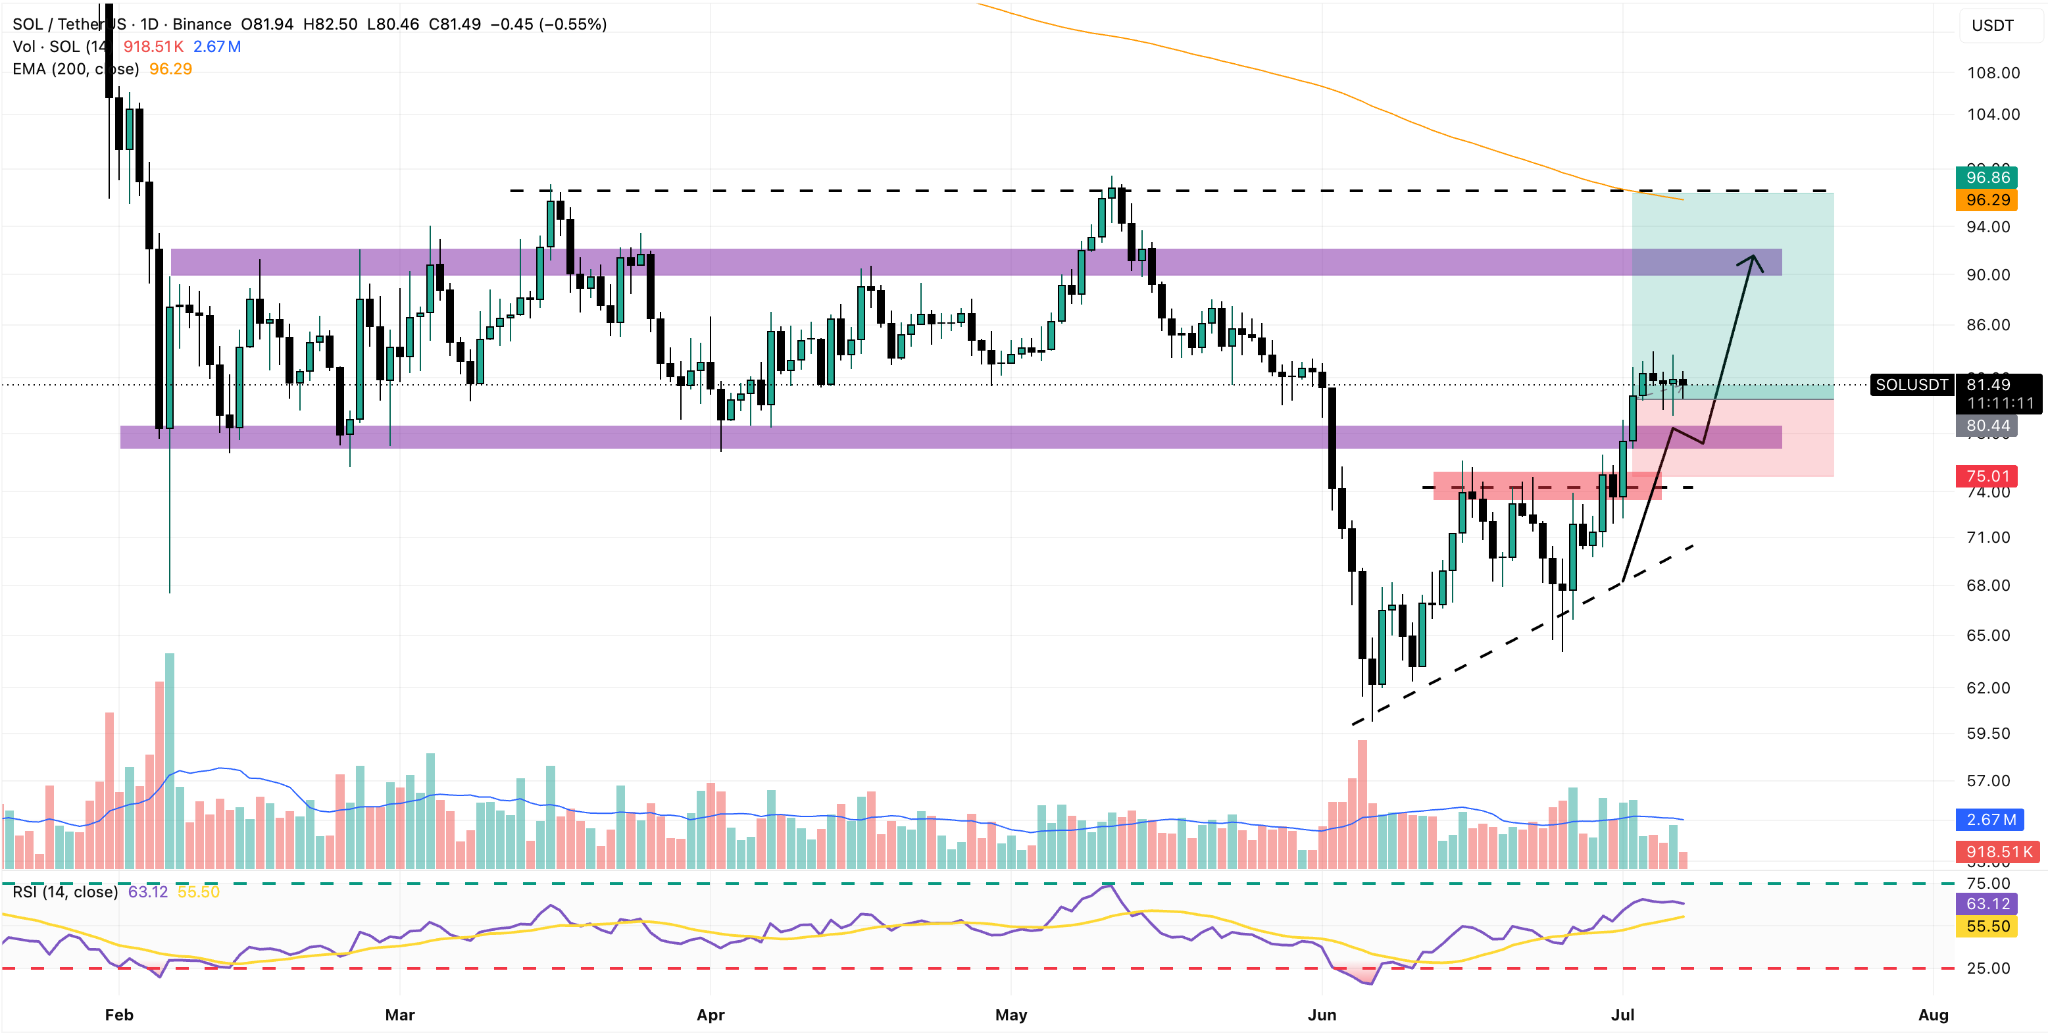
Meanwhile, the token recaptured the $80 price zone after breaking above the $77 resistance, and is now hovering above this key threshold as traders prepare for the next big move.
Last week, we outlined an interesting trading opportunity that is already sitting at its ideal entry price. We expect a retest of the 200-day exponential moving average (EMA) in the next few days if bullish momentum accelerates. This key line currently sits at $96, meaning a 17% upside potential.
With that target in mind, entering a long position at $80 would offer a 3x risk-reward ratio if the stop price is set right below the $77 support area.
The Relative Strength Index (RSI) has already sent a buy signal as this momentum indicator rose above 60. Hence, most of Solana’s technical variables are flashing buy while momentum seems to be on its side as indicated by its latest positive performance relative to the rest of altcoins.