
U.S. Dollar Moves Higher As Oil Prices Rally
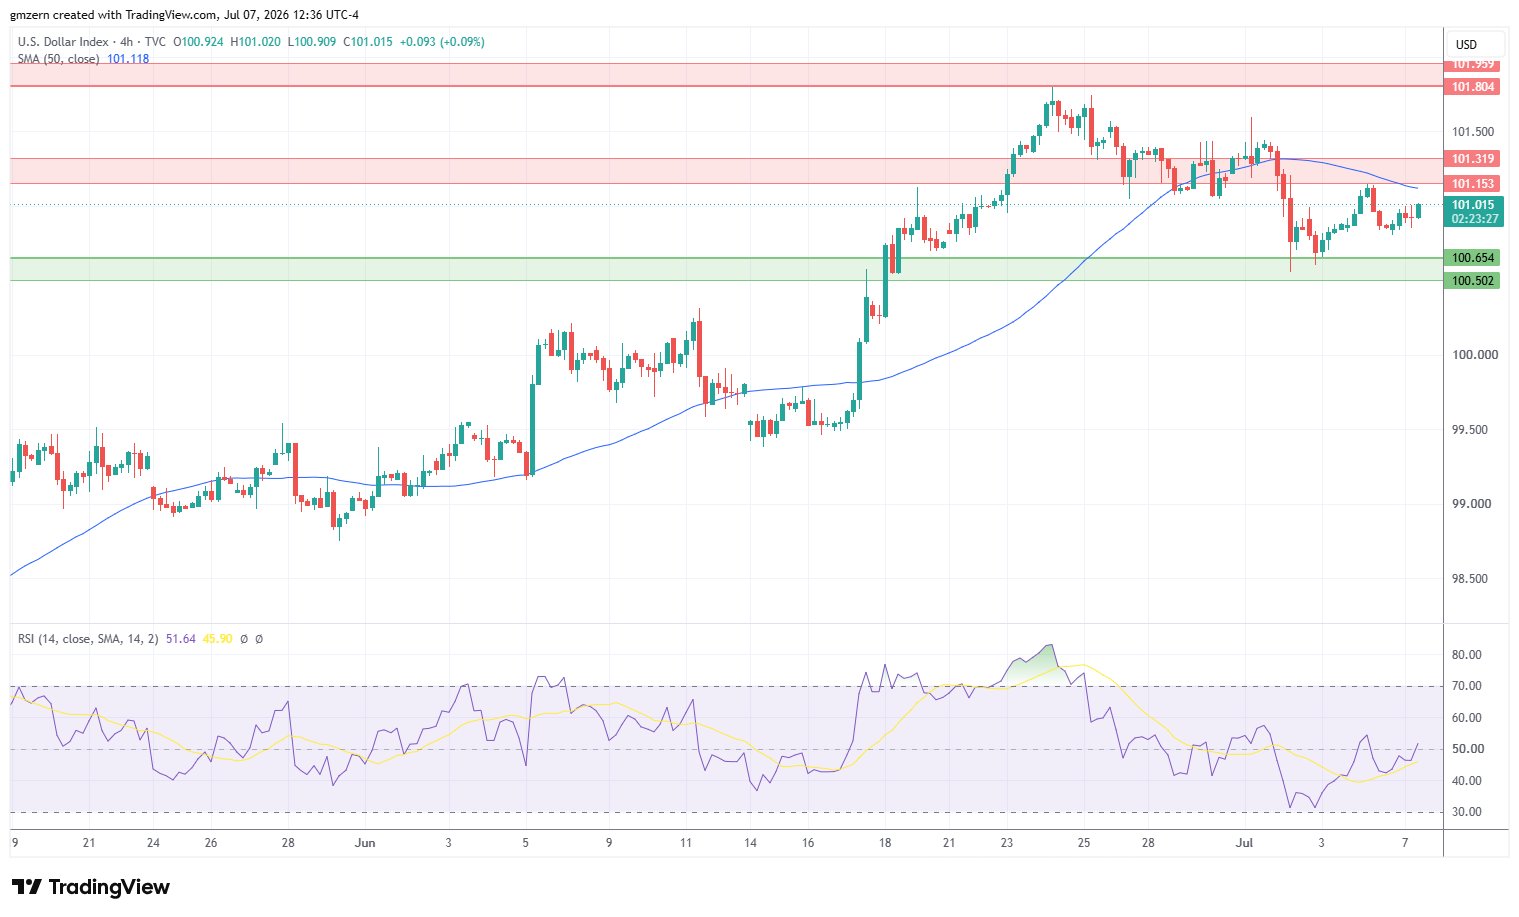
U.S. Dollar Index gains ground as traders focus on the rally in the oil markets. An LNG carrier from Qatar was hit in the Strait of Hormuz. A Saudi oil tanker also suffered damage. Iran insists that ships should go through approved routes.
The nearest resistance level for U.S. Dollar Index is located in the 101.15 – 101.30 range. In case U.S. Dollar Index manages to settle above the 101.30 level, it will head towards the next resistance, which is located in the 101.80 – 101.95 range.

EUR/USD Tests Support At 1.1420 – 1.1435
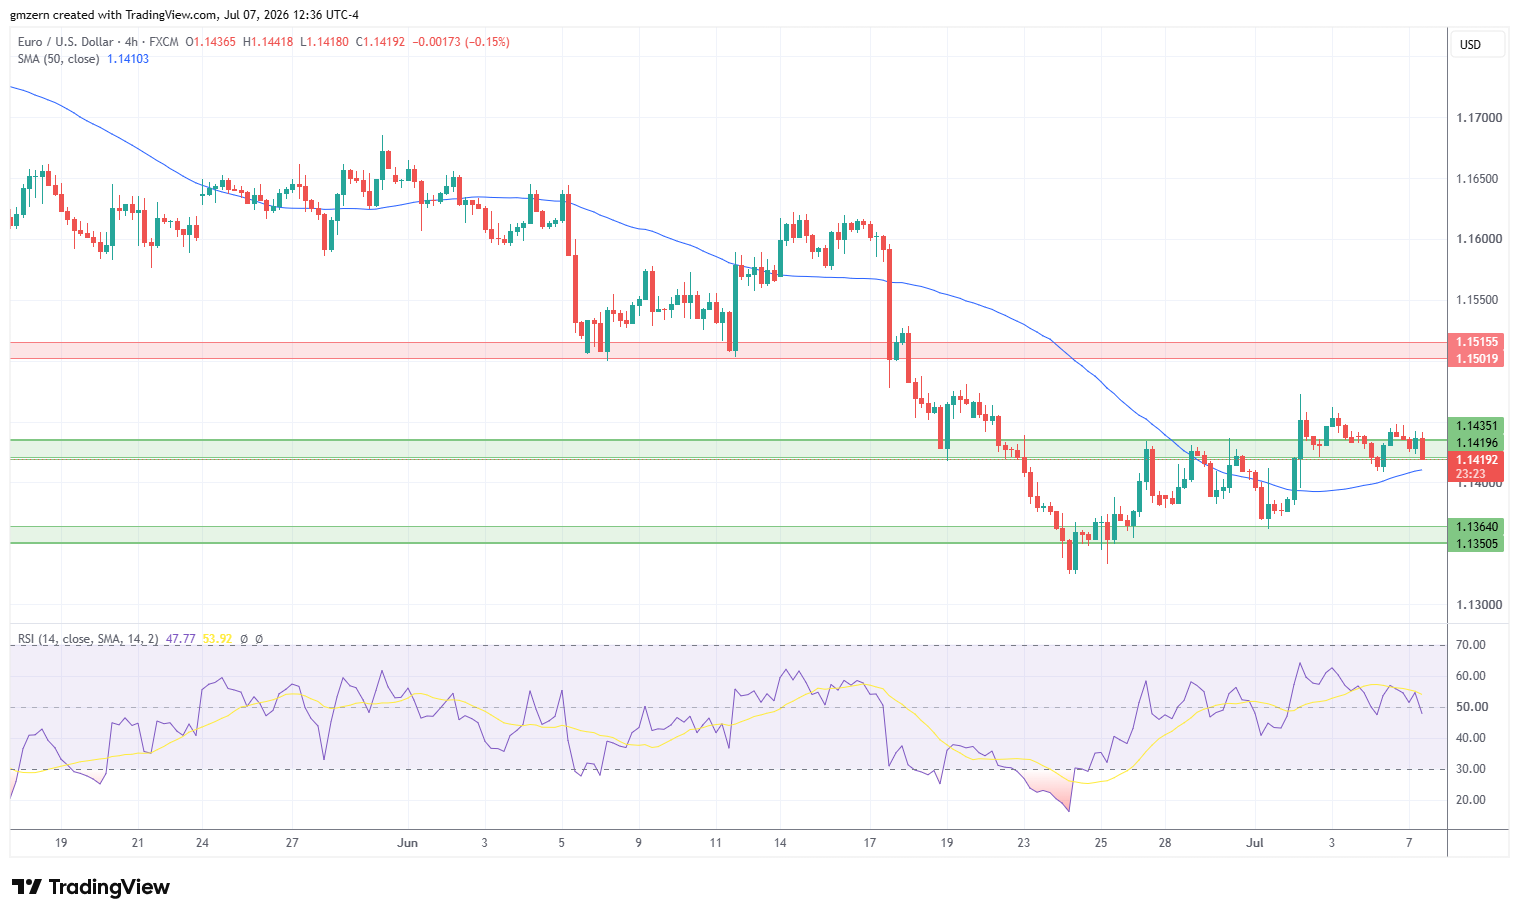
EUR/USD pulled back as demand for risk assets declined after attacks on vessels in the Strait of Hormuz.
Traders also focused on the Industrial Production report from Germany. The report indicated that Industrial Production increased by +0.9% month-over-month in May, compared to analyst consensus of +0.2%.
Currently, EUR/USD is trying to settle below the support level at 1.1420 – 1.1435. This support level has already been tested several times and proved its strength. In case EUR/USD manages to settle below the 1.1420 level, it will get to the test of the 50 MA at 1.1410. A move below the 50 MA will open the way to the test of the support level at 1.1350 – 1.1365.
GBP/USD Retreats Amid Falling Demand For Risk Assets
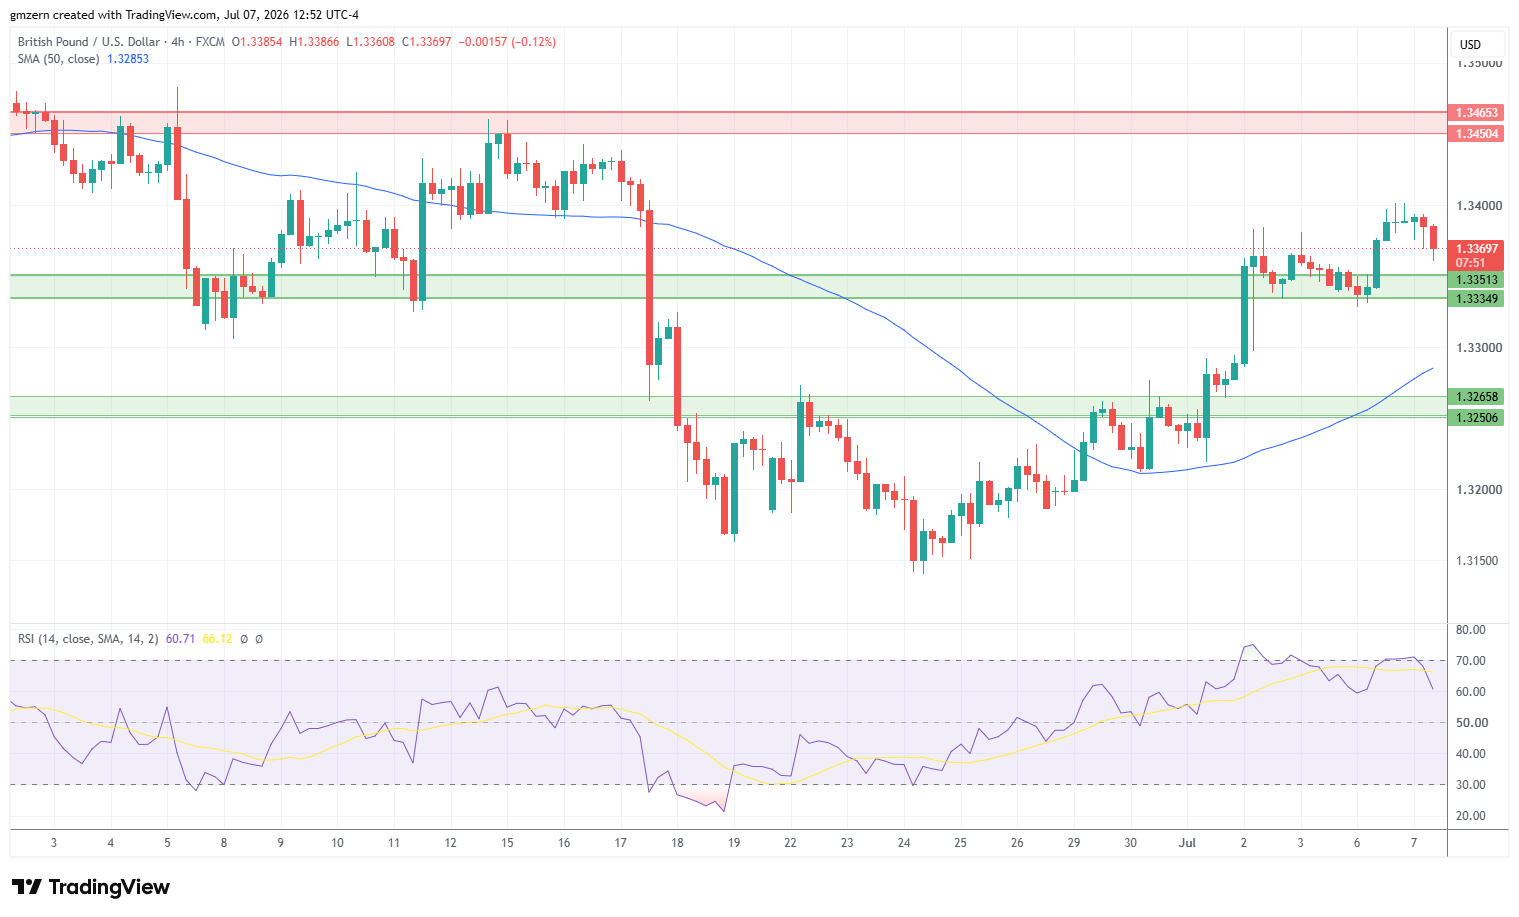
GBP/USD is losing ground as traders focus on general strength of the American currency.
EUR/USD Price Forecast
Every new EUR/USD analysis as it publishes, today's technical signal and key levels, live price — on one page.
See all EUR/USD forecastsFrom the technical point of view, GBP/USD failed to settle above the 1.3400 level and pulled back towards 1.3370. The nearest support level for GBP/USD is located in the 1.3335 – 1.3350 range.
If GBP/USD declines below the 1.3335 level, it will head towards the 50 MA at 1.3285. In case GBP/USD manages to settle below the 50 MA, it will move towards the next support level at 1.3250 – 1.3265.
USD/CAD Tests The 1.4200 Level
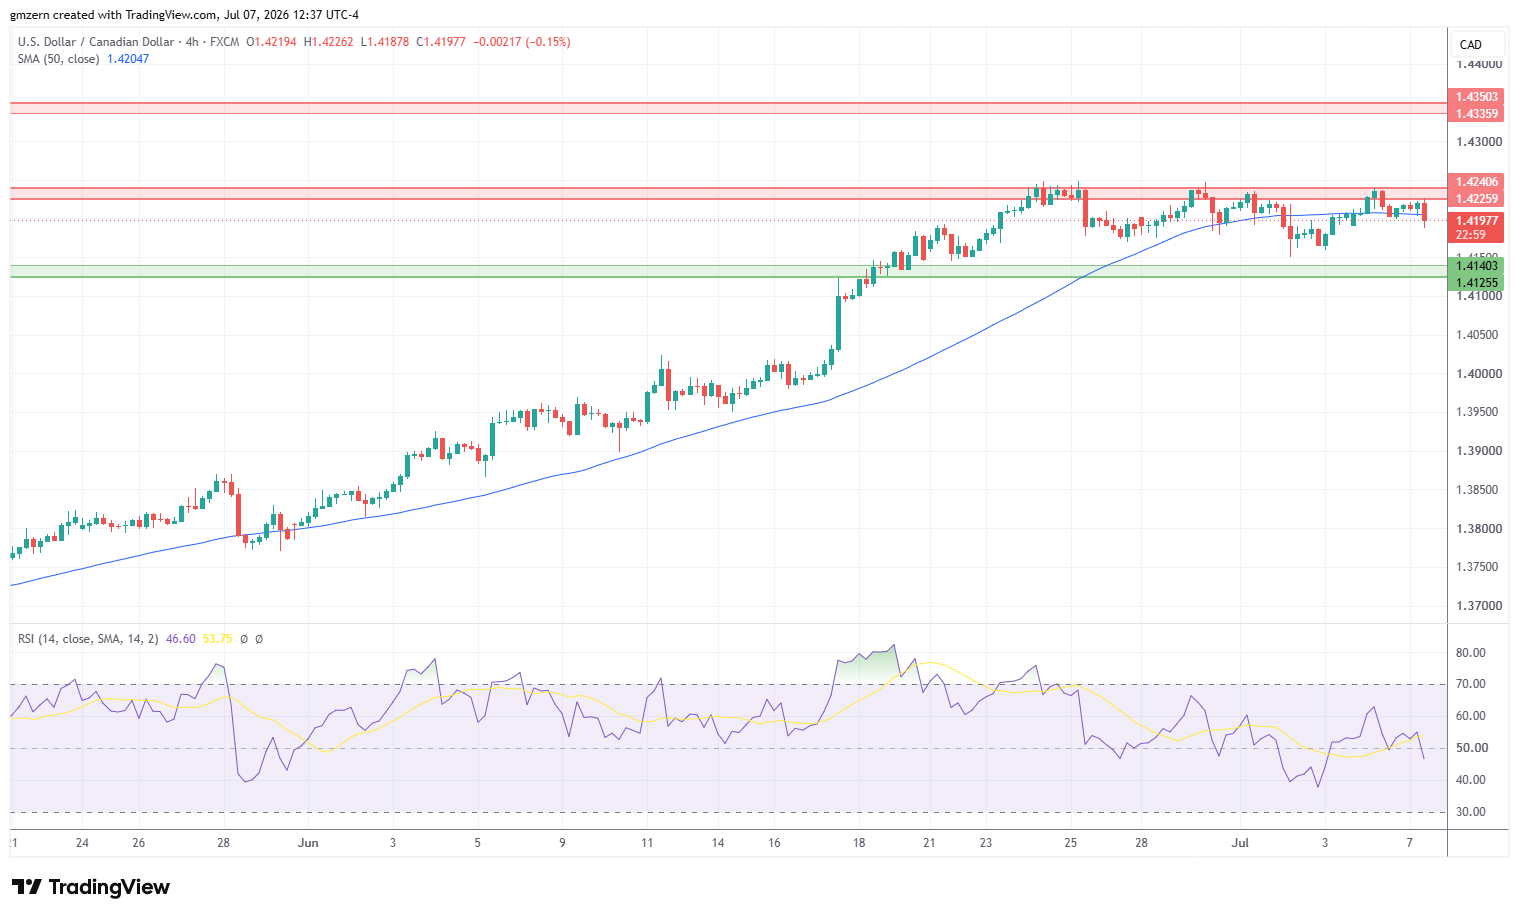
USD/CAD remains stuck below the resistance at 1.4225 – 1.4240 as traders focus on the strong rally in the oil markets. Gold and silver are losing ground, which is bearish for the Canadian currency. Other commodity-related currencies are moving lower in today’s trading session.
If USD/CAD settles below the 50 MA at 1.4204, it will head towards the support level at 1.4125 – 1.4140. RSI is in the moderate territory, so there is plenty of room to gain additional downside momentum in case the right catalysts emerge.
On the upside, USD/CAD needs to settle above the resistance level at 1.4225 – 1.4240 to gain upside momentum in the near term. A move above 1.4240 will push USD/CAD towards the next resistance at 1.4335 – 1.4350.
USD/JPY Remains Stuck Near Key Resistance Level
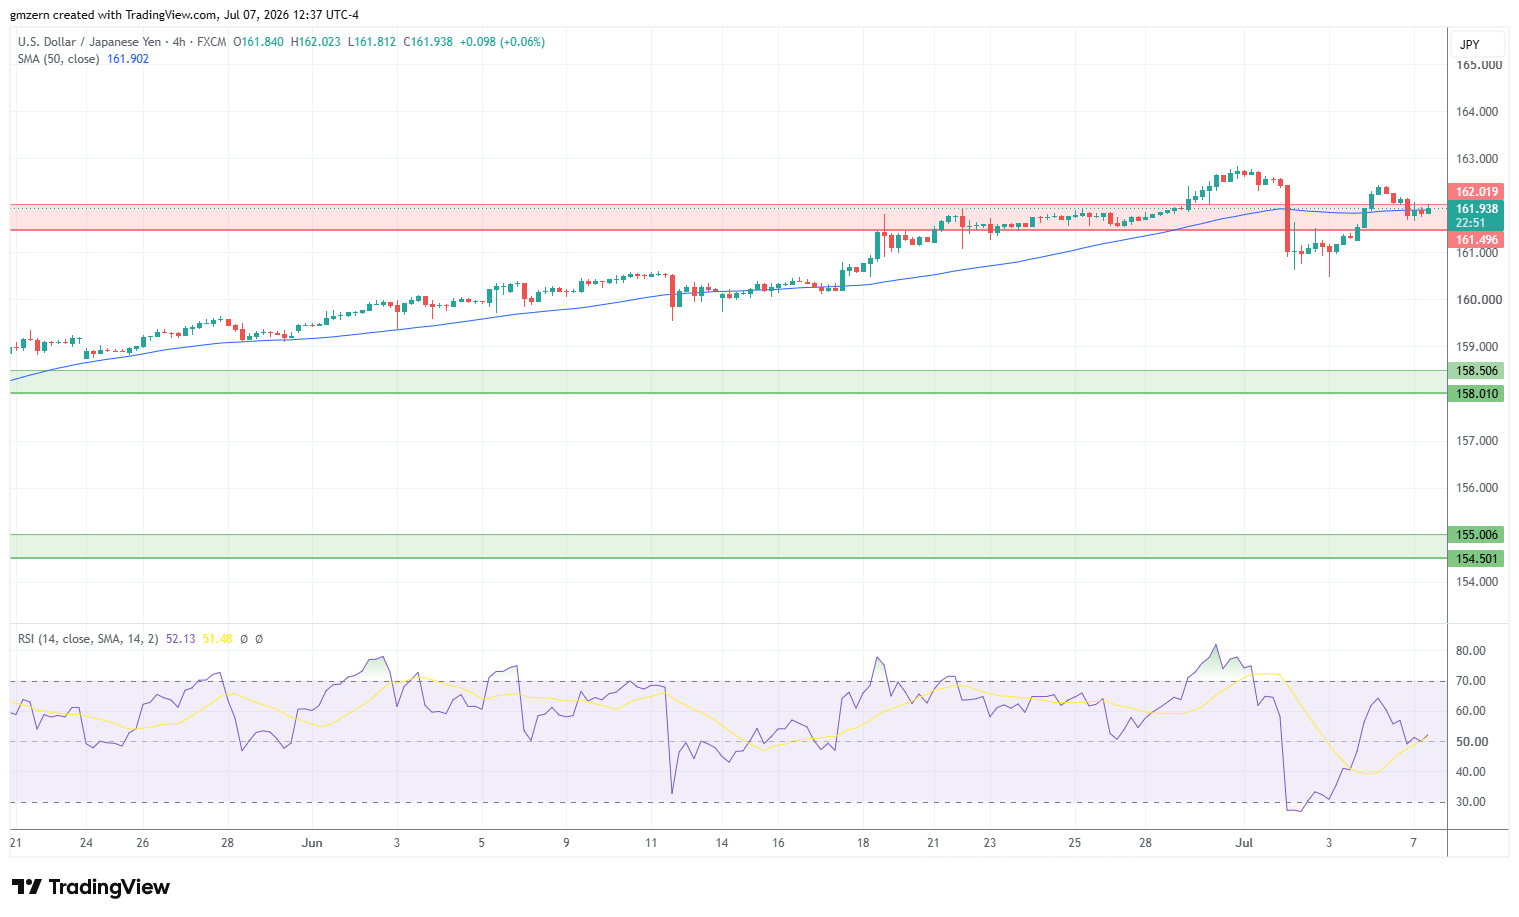
USD/JPY is losing some ground as traders react to the Household Spending report from Japan. The report indicated that Household Spending increased by +3.7% month-over-month in May, compared to analyst forecast of +1.4%. On a year-over-year basis, USD/JPY declined by -0.4%, compared to analyst consensus of -2.5%.
The technical picture remains unchanged as USD/JPY is trying to settle above the resistance level at 161.50 – 162.00. If USD/JPY settles above the 162.00 level, it will move towards recent highs near 162.80. A move above the 162.80 level will push USD/JPY towards the 165.00 level.
If you’d like to know more about how to trade forex, please visit our educational area.