
Market Overview
Oil and gas fundamentals reflect continued OPEC+ supply discipline in the face of growing non-OPEC output, from US shale plays, along with summer peak driving demand for transport fuels. Stock movements in major US hubs are relatively modest, reflecting balanced supply and offtake. US crude stock changes, from recent figures released on July 8, were relatively small, and US inventories are currently hovering near working lows. Oil product stock levels and demand remain strong, with oil demand underpinned by general economic strength.
Meanwhile, US natural gas production continues to reach new highs, including associated gas from oil wells and dry gas from dedicated gas wells. The US LNG export industry remains very busy, with significant volumes going abroad. US natural gas working inventories continue to fill through the injection season and remain above normal levels. US gas demand remains steady on the industrial side, and variable on the power sector depending on the weather. These factors reflect a well-supplied US market with the ability to meet both domestic and international demand.

Natural Gas Futures Rises to $3.290 – EMA 50 Defense on 2h
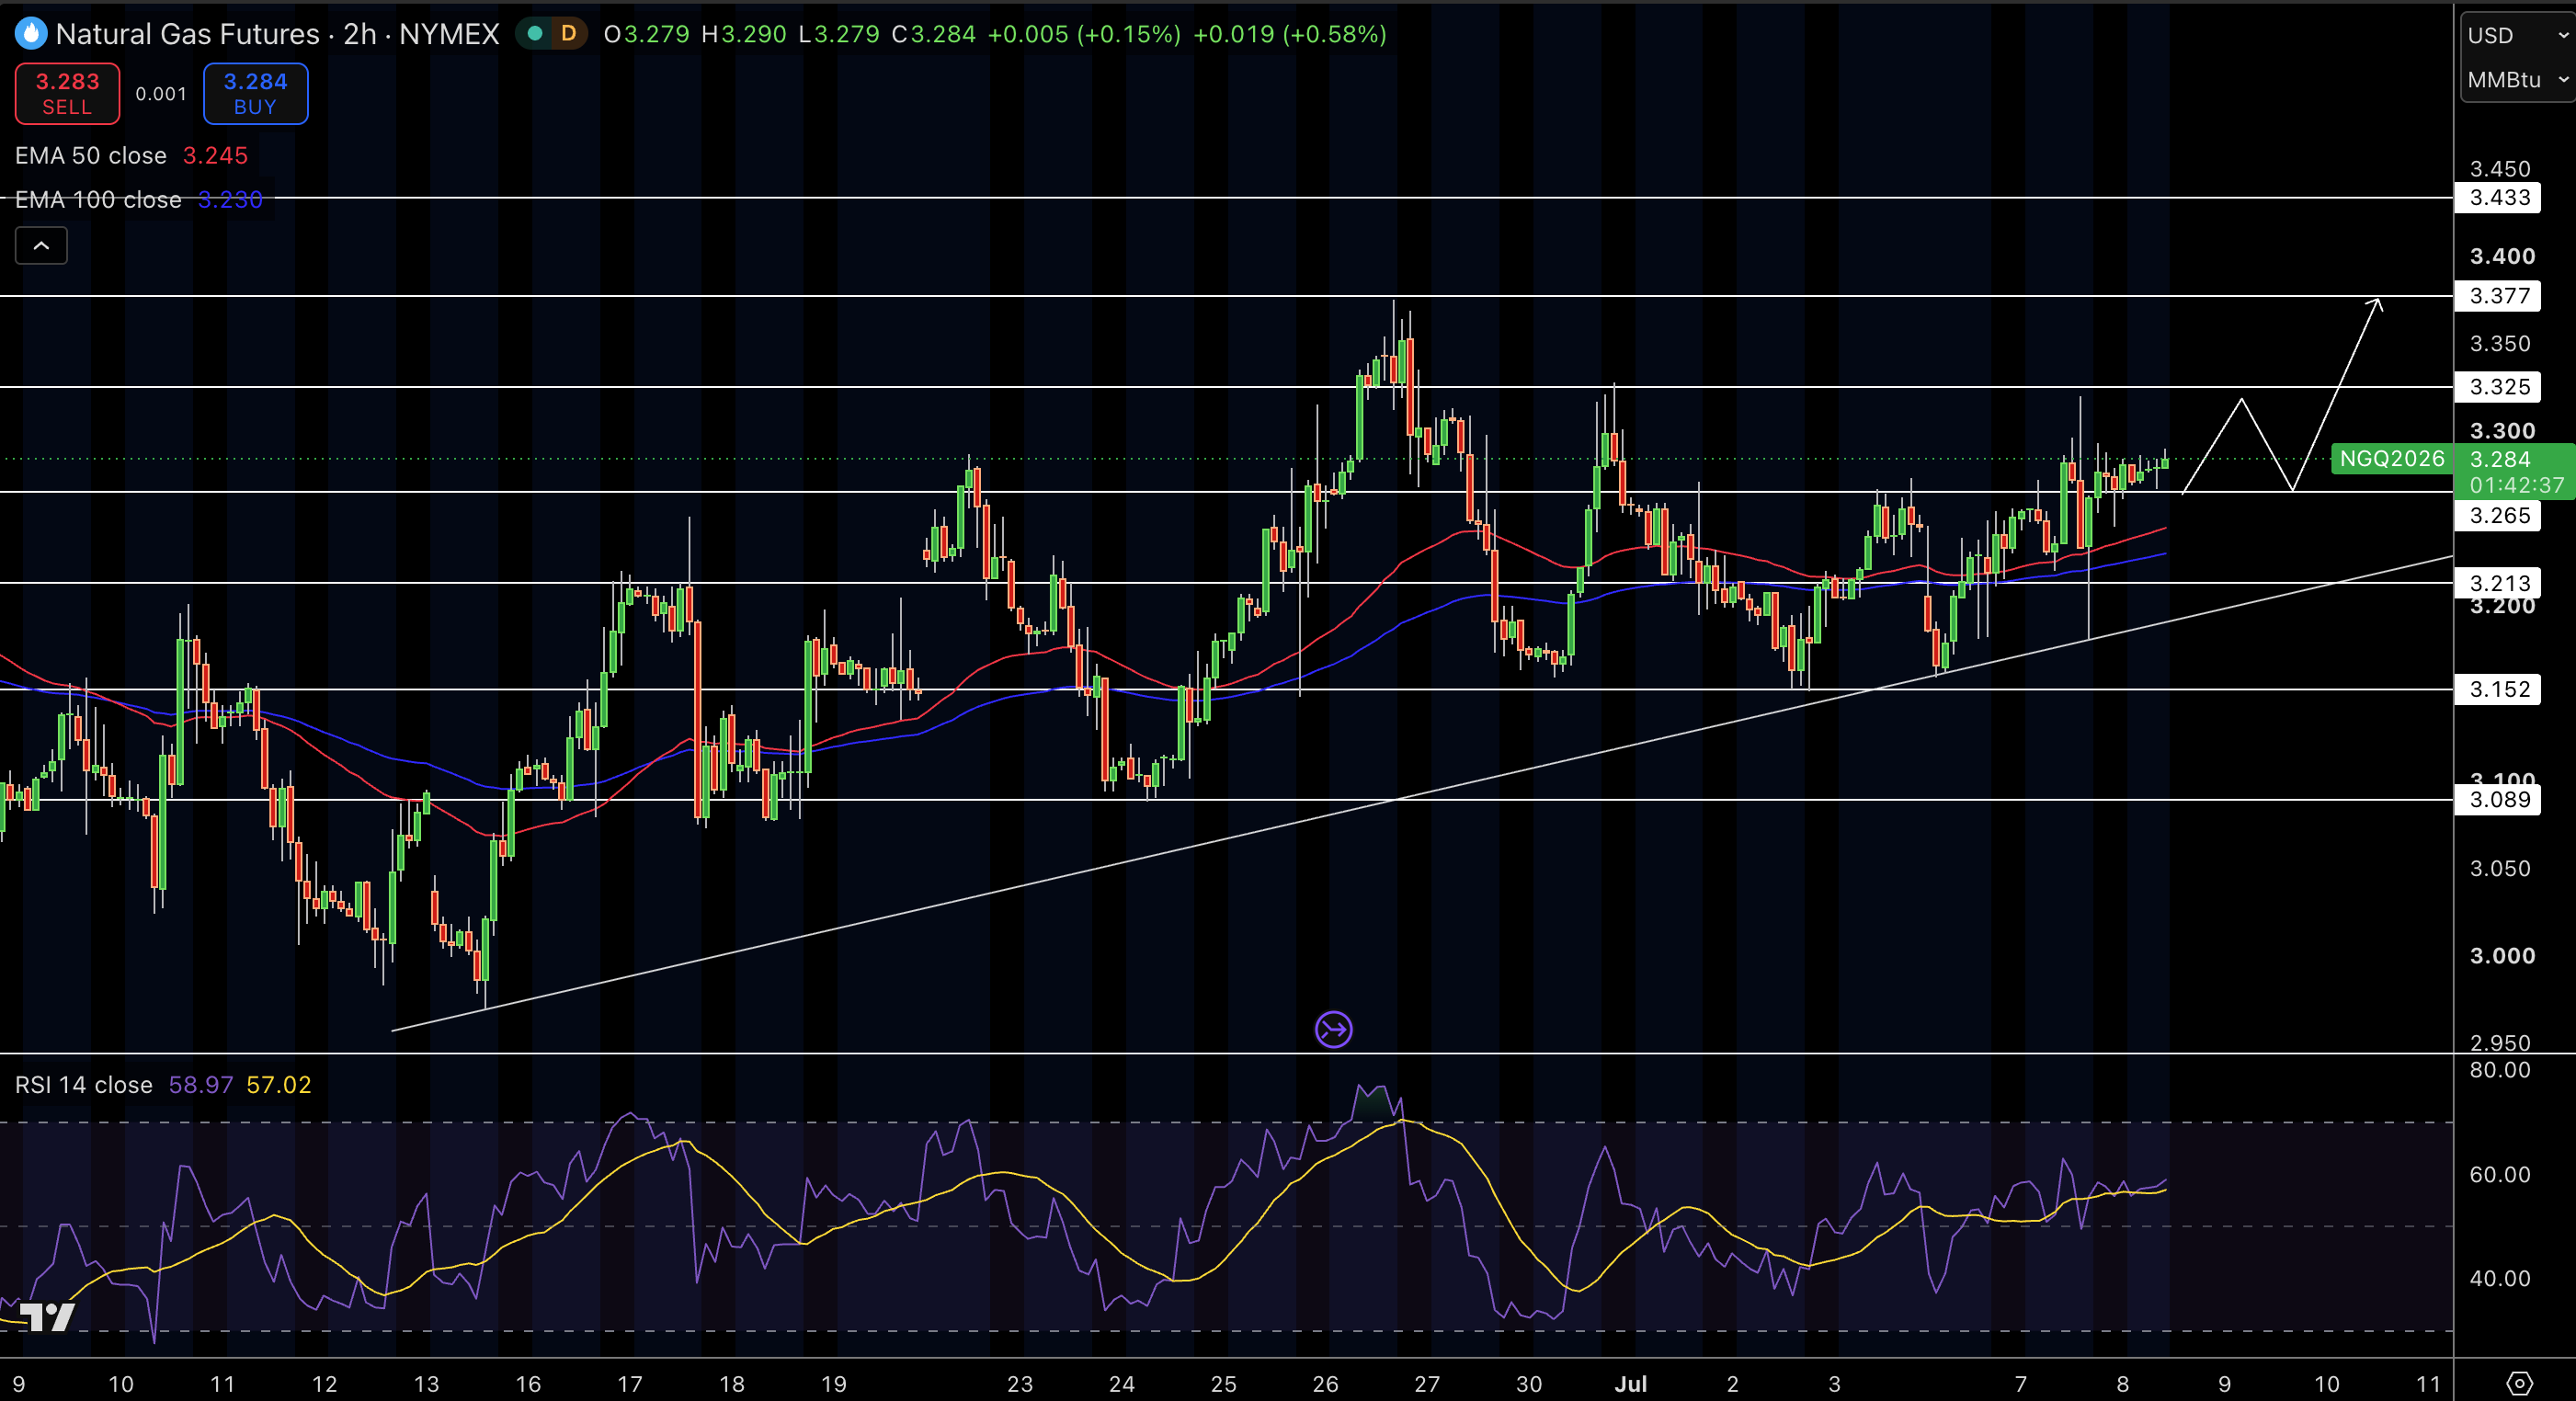
Natural Gas price is trading at $3.290 on 2h NYMEX charts and has shown bullish reaction to $3.245 EMA 50 support level after the initial $3.230 EMA 100 rejections. The candle structure shows several strong bullish rejection wicks from $3.099 low swing level showing buyer defense. The RSI level is at about 60.
The volume map shows strong support at $3.12 and the Fib 1.618 extension level is at $3.229 to $3.260. The market continues to remain bullish in a clean ascending channel at $3.099 low levels as price continues printing higher highs and higher low swing structure maintaining short-term dips control from the buyers side.
Trade Idea: Buy at $3.290, take profit at $3.260, stop loss at $3.12.
WTI Crude Oil Rises to $72.72 – Fib 0.618 Retest on 1D
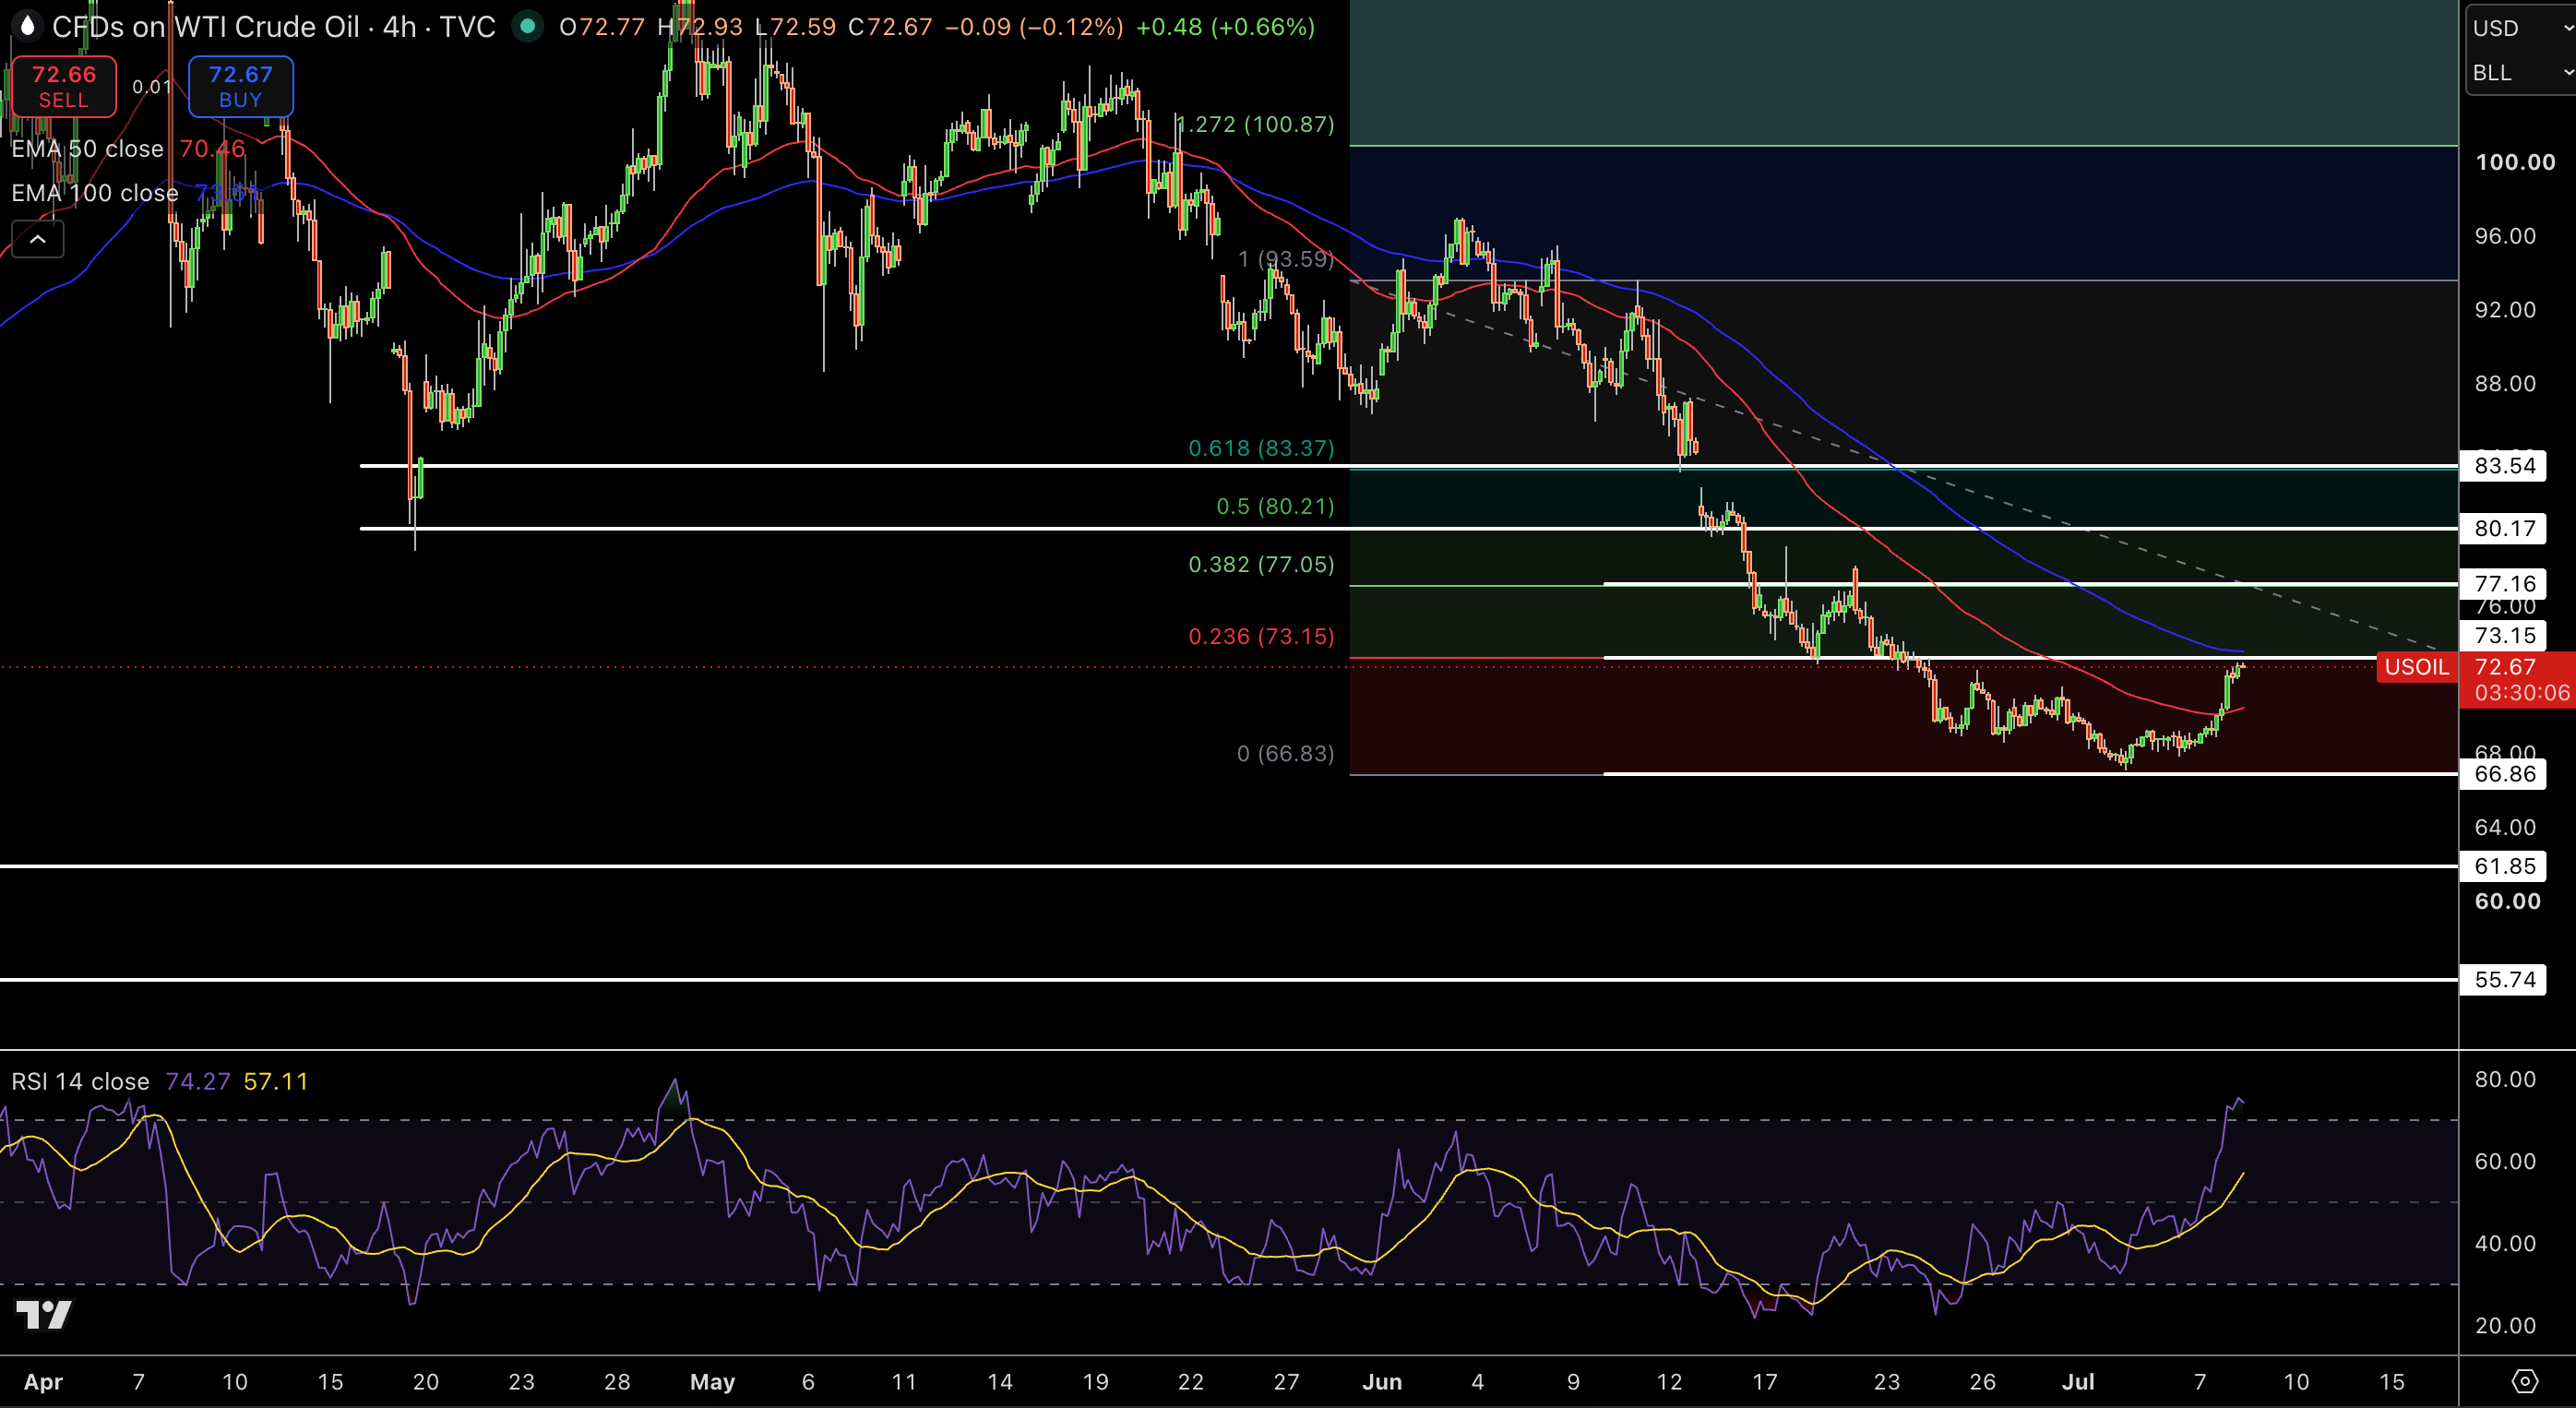
WTI is trading at $72.72 in the 1D time frame and is testing the Fib 0.618 retest level near the $83.37 extension after several consecutive bullish candles following the price rebound from $66.83 low levels. The chart shows bullish candle bodies printing higher highs and holding at the $83.16 blue EMA 100 level confirming the dominance of buyers. The RSI level is hovering near 39 in the neutral area.
Natural Gas Price Forecast
Every new Natural Gas analysis as it publishes, today's technical signal and key levels, live price — on one page.
See all Natural Gas forecastsThe volume map is showing a pivot area at $73.15-$77.05 and the next major resistance area is at $80.21-$83.37. Despite the bearish trend at $110 high levels, the price structure is stabilizing from $73.15 low level and buyers continue to absorb price dips in the $73.15 higher low range.
Trade Idea: Buy at $72.72, take profit at $80.21, stop loss at $73.15.
Brent Crude Oil Holds $76.56 – Blue Descending Channel Floor on 2h
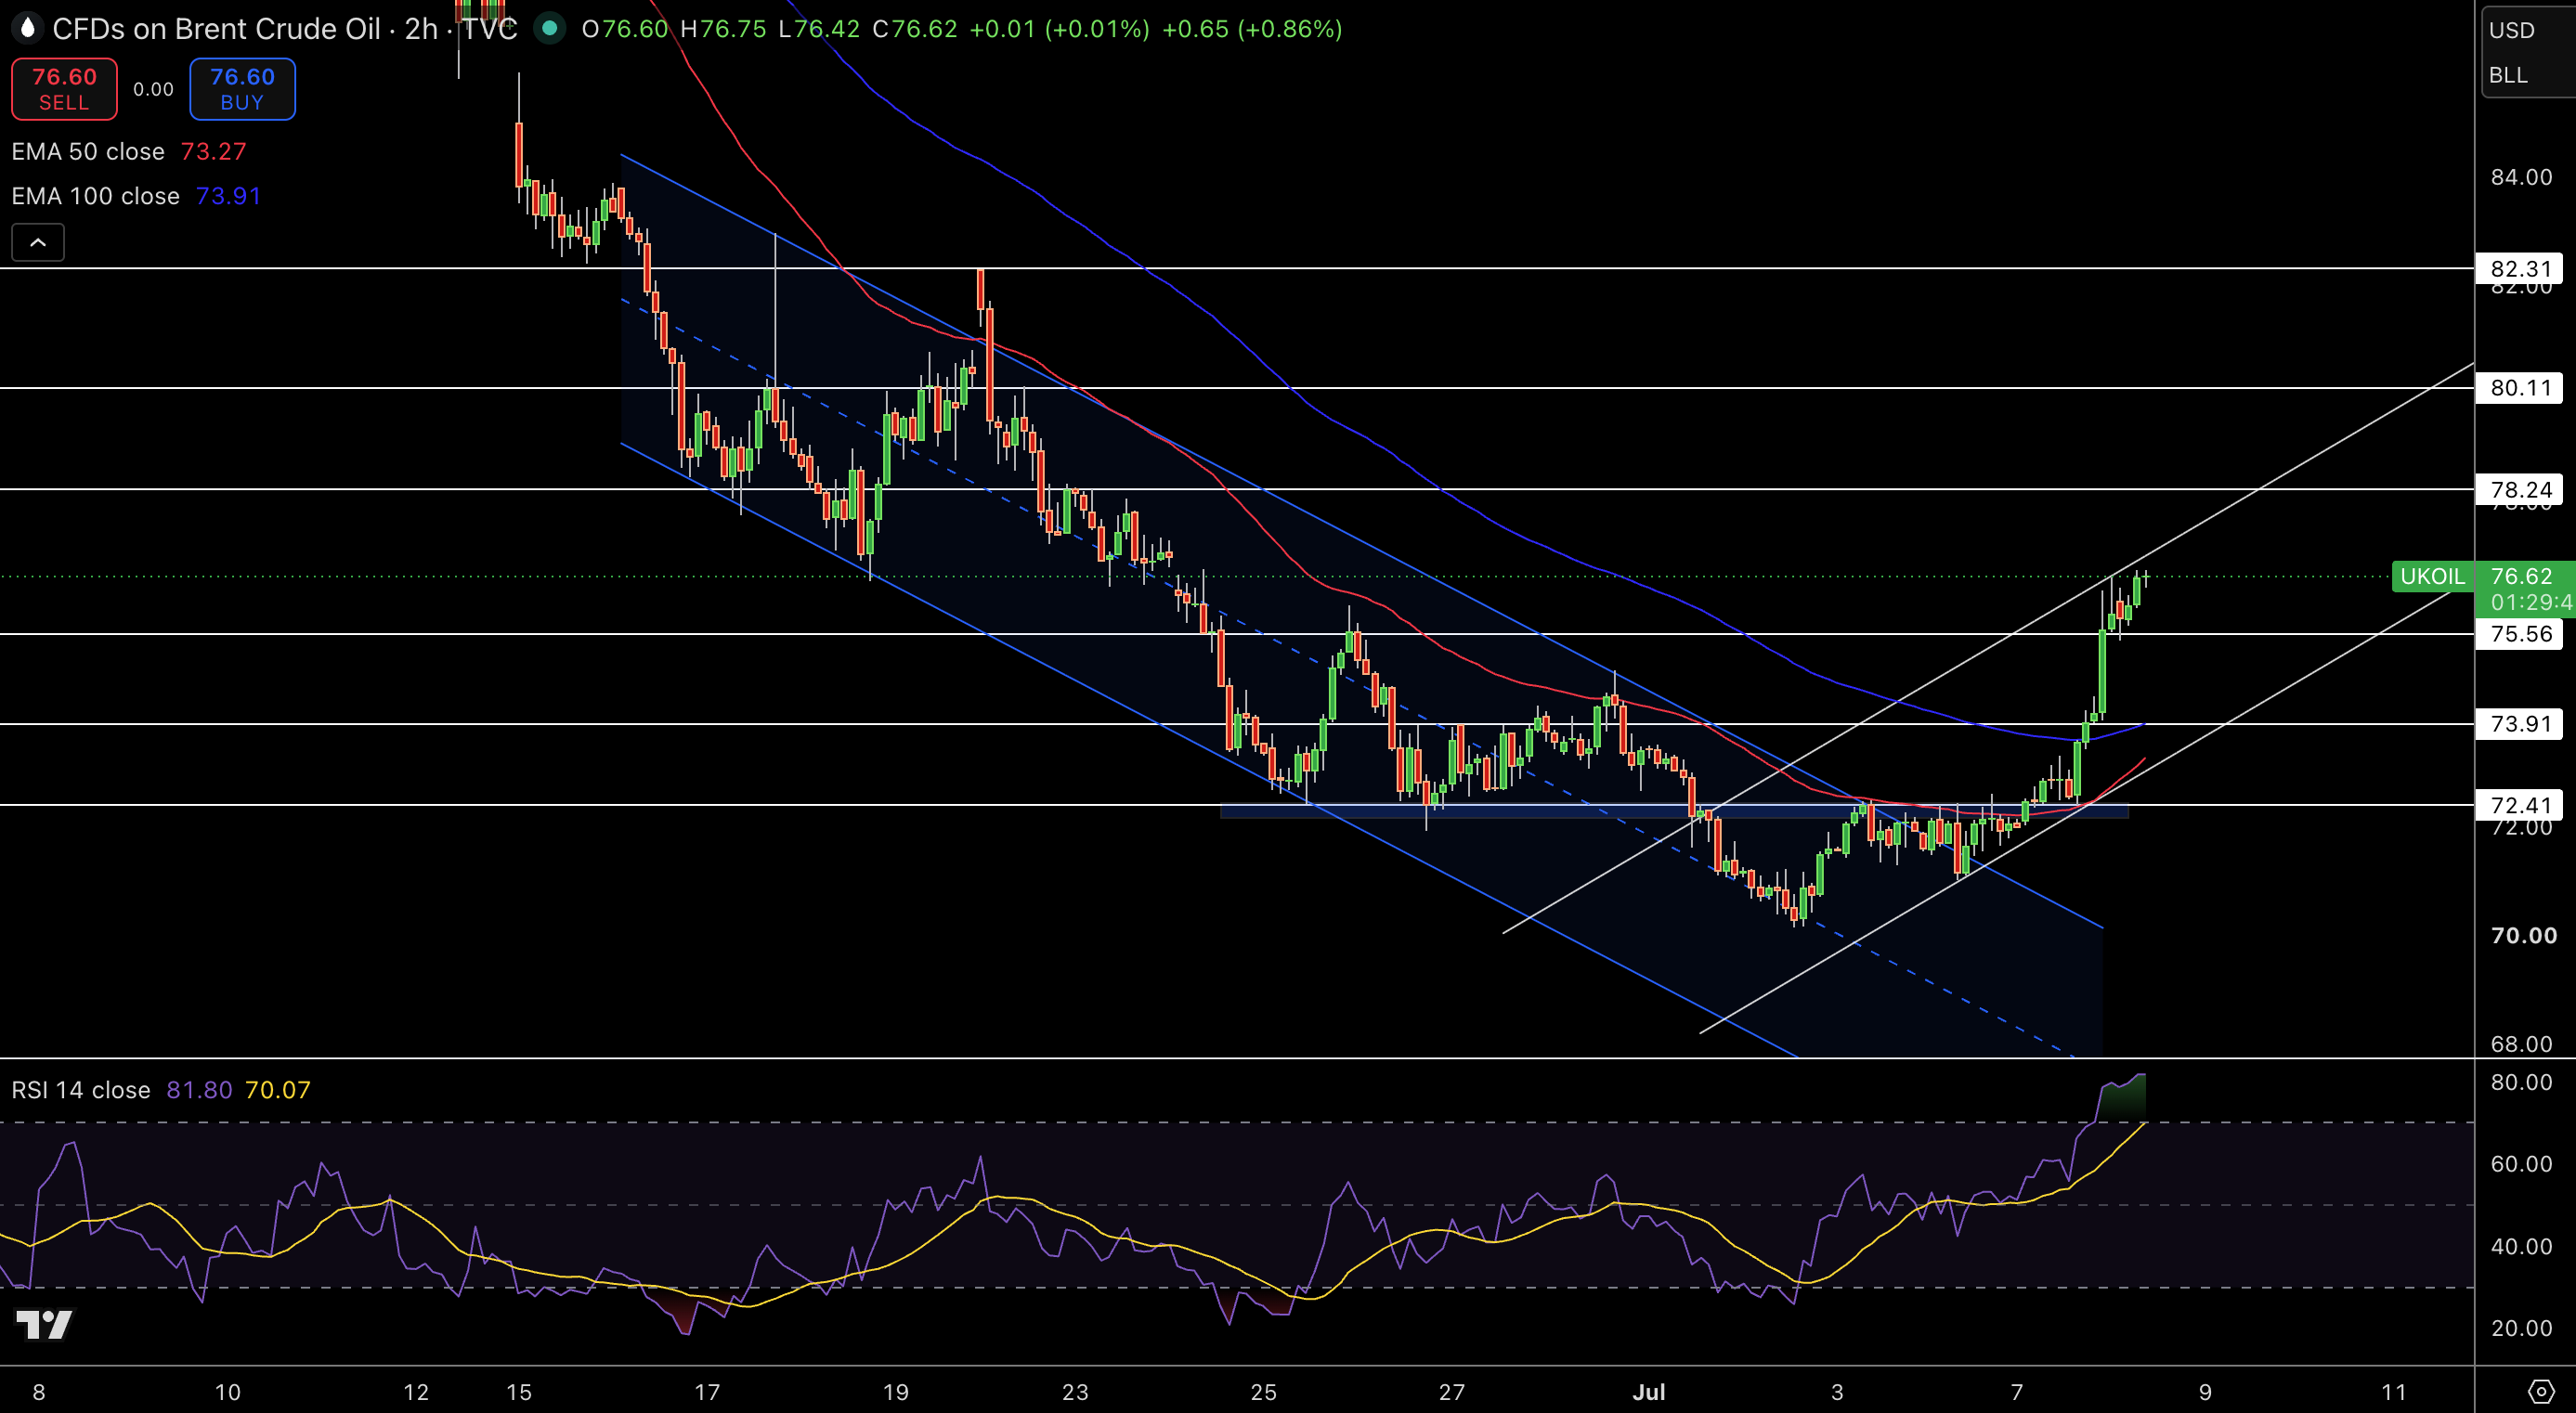
Brent price trades at $76.56 in the 2h time frame. After the price bounced from the $78.27 red MA level, the price tested the blue channel support level at $76.09 alternating between bullish and bearish candle bodies. Bullish wicks were printed at the $76.09 channel support level and there was little to no follow-through selling confirming the absorption from buying. The RSI level is near 80.
The volume map is forming a fair value range of $76 to $77. The price is still under resistance from the next $78.24-$80.11 level. Price remains neutral to bullish above the blue channel at $76.09 in the overall bearish trend from $110 while the $76.09 higher low levels continue to absorb sell-side price dips from buyers.
Trade Idea: Buy at $76.56, take profit at $78.24, stop loss at $76.09.