
Precious Metals Fundamentals Supported by Central Bank Demand and Supply Limits
Gold and silver fundamentals as of July 8 remain supported by persistent central bank buying and low growth in primary supply. Central banks keep on accumulating gold and silver to diversify their reserves in an era of high public debts and monetary uncertainty. Official sector purchases have been a reliable base, irrespective of swings in investment flows.
Primary supply growth of gold and silver is relatively low. Growth in gold production has been relatively subdued recently due to a decline in ore grades and high costs, and the same is also true for the production of silver. Secondary supply in the form of recycling continues to respond to incentives for selling.
Silver’s fundamentals are bolstered by growth in fabrication demand, particularly for solar panels, electronics and electric cars as part of the global transition to clean energy. Investment demand is also supported by the allocation to precious metals via funds and in physical form.

Gold Spot Holds $4,126 – Double Top Pattern on 4h
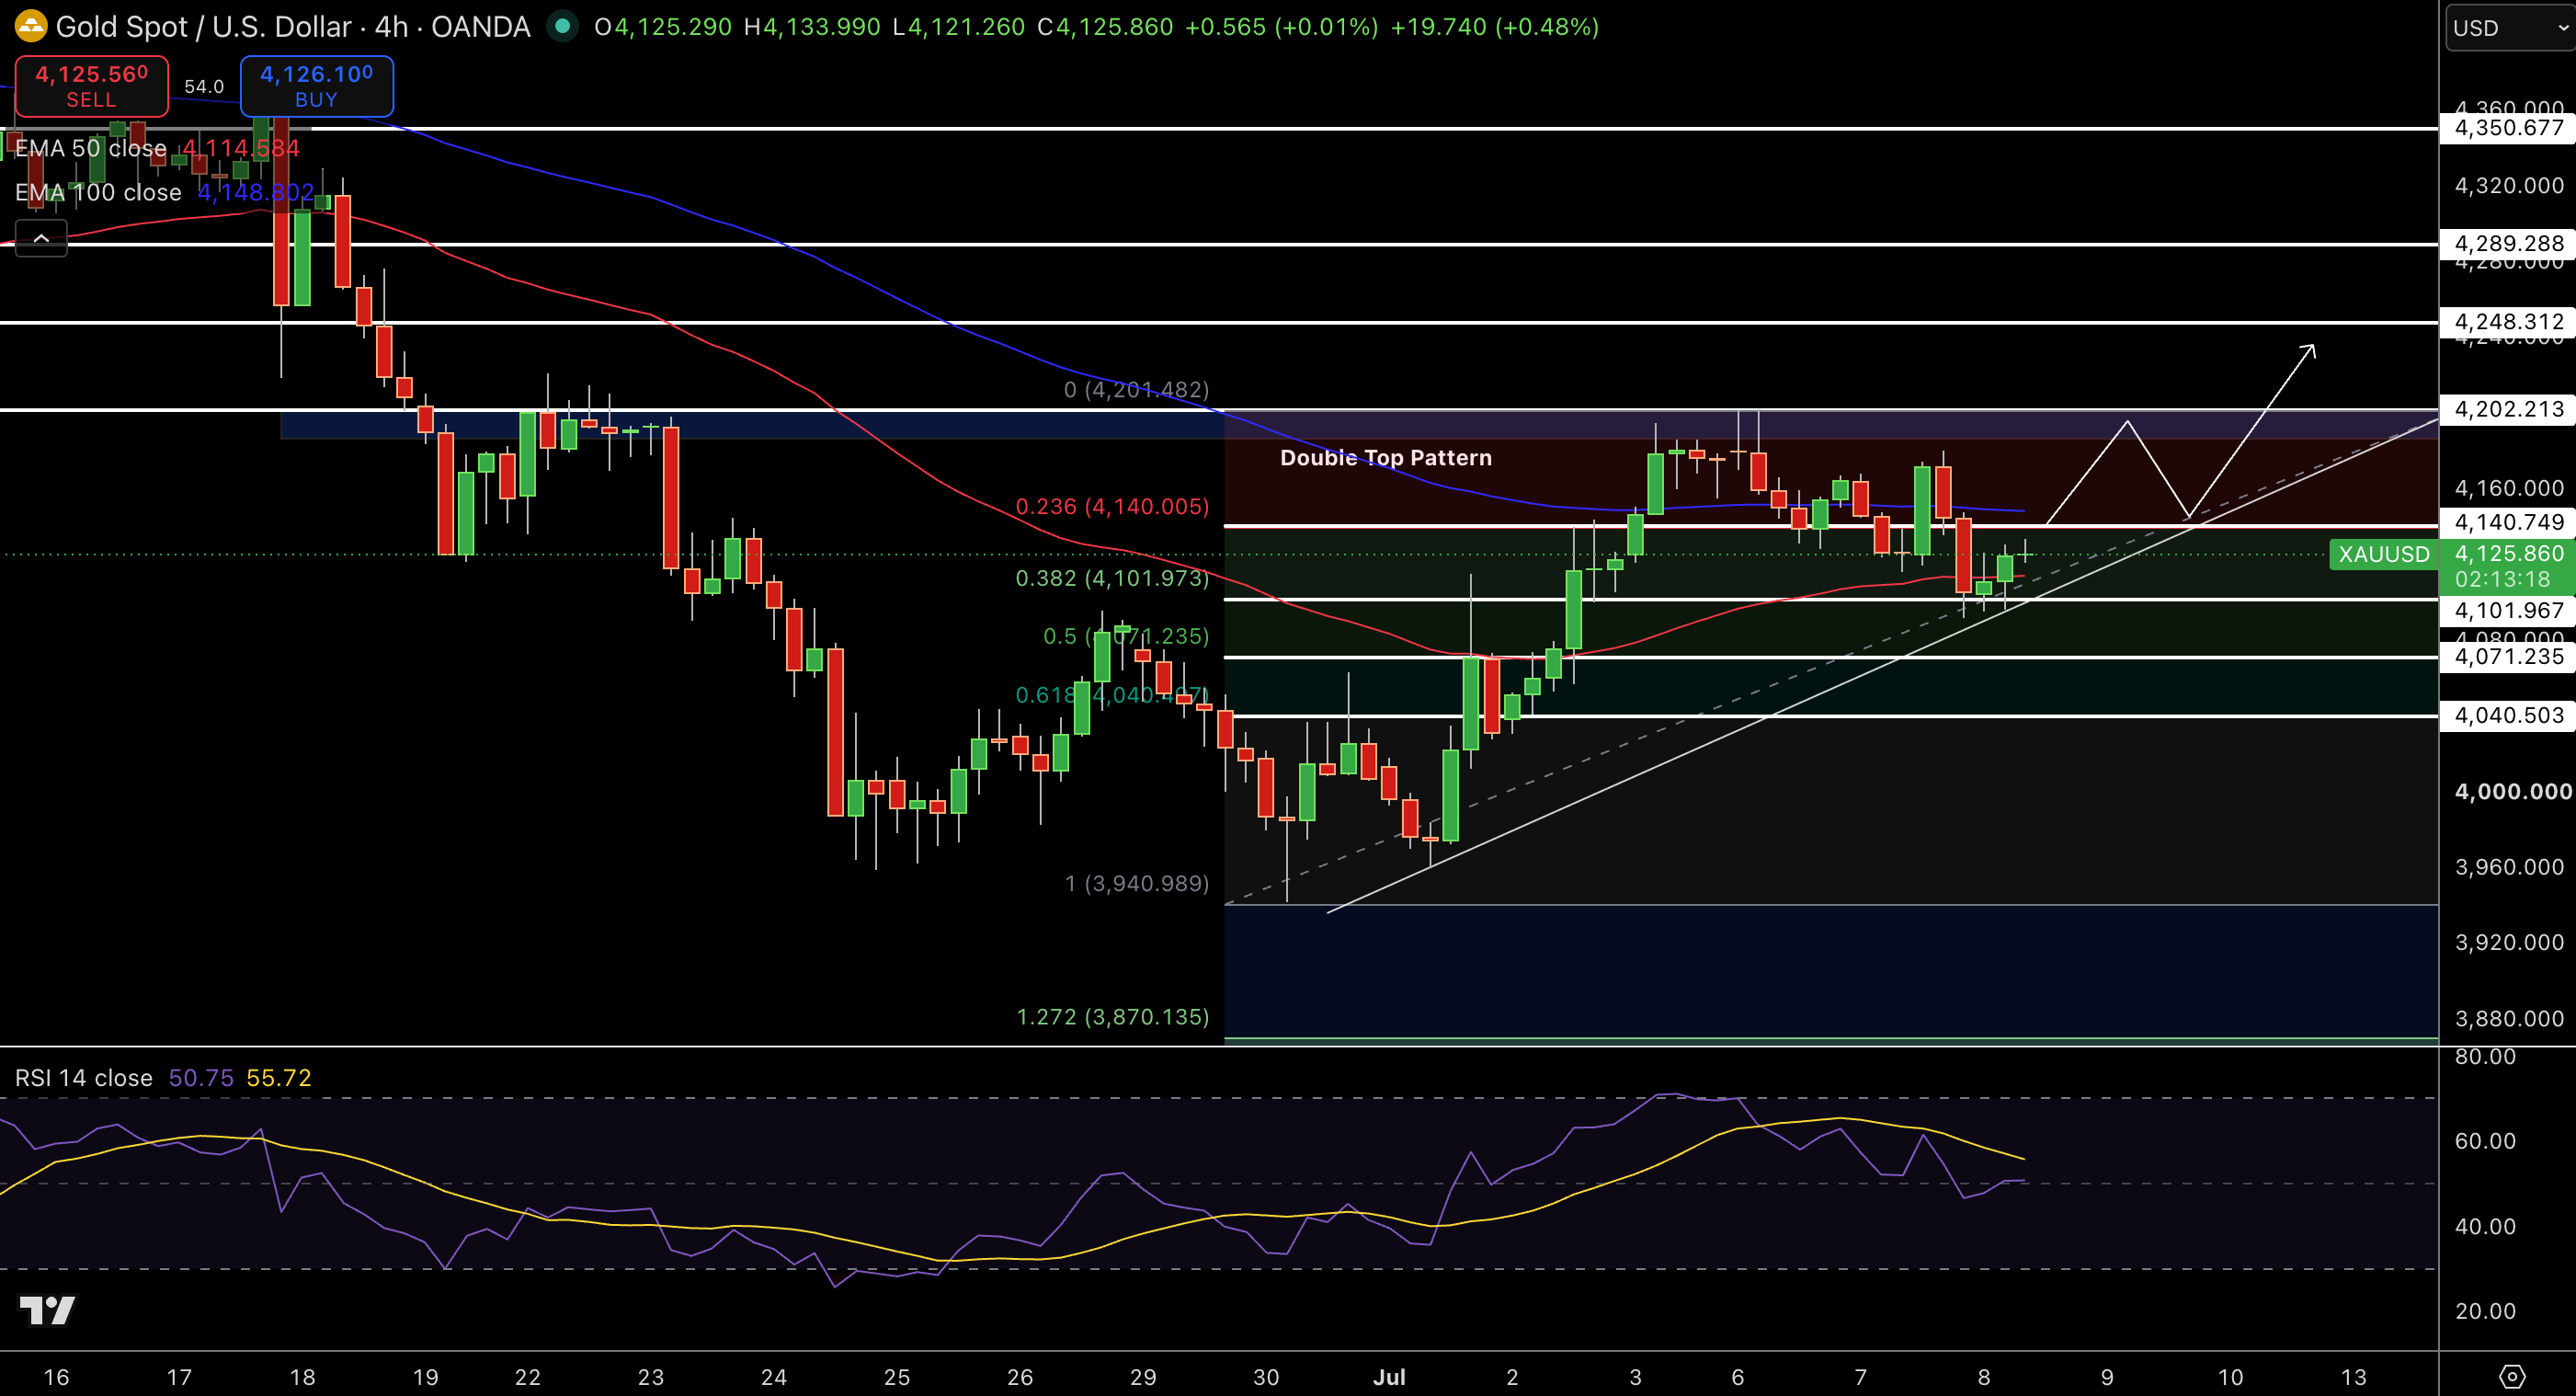
Gold stays around $4,126 as the 4-hour chart depicts a double top forming on green and red candles near $4,140. This double top formed following rejection from the 50-period EMA around $4,115. With the price holding above the triple bottom on the green candles near $3,959, the lower high bearish candles point to distribution. RSI sits close to 51, suggesting neutral momentum. The volume profile marks a zone of resistance from $4,091 to $4,140.
The blue 50-period EMA around $4,115 is still limiting upside. Gold Spot looks neutral to bearish below $4,140 on the broader down channel pattern. The lower highs have been keeping sellers in trades on rallies.
Trade Idea: Sell $4,126, targeting $4,091, with a stop at $4,140.
Silver Spot Rises to $60.78 – Fibonacci 0.618 Retest on 4h
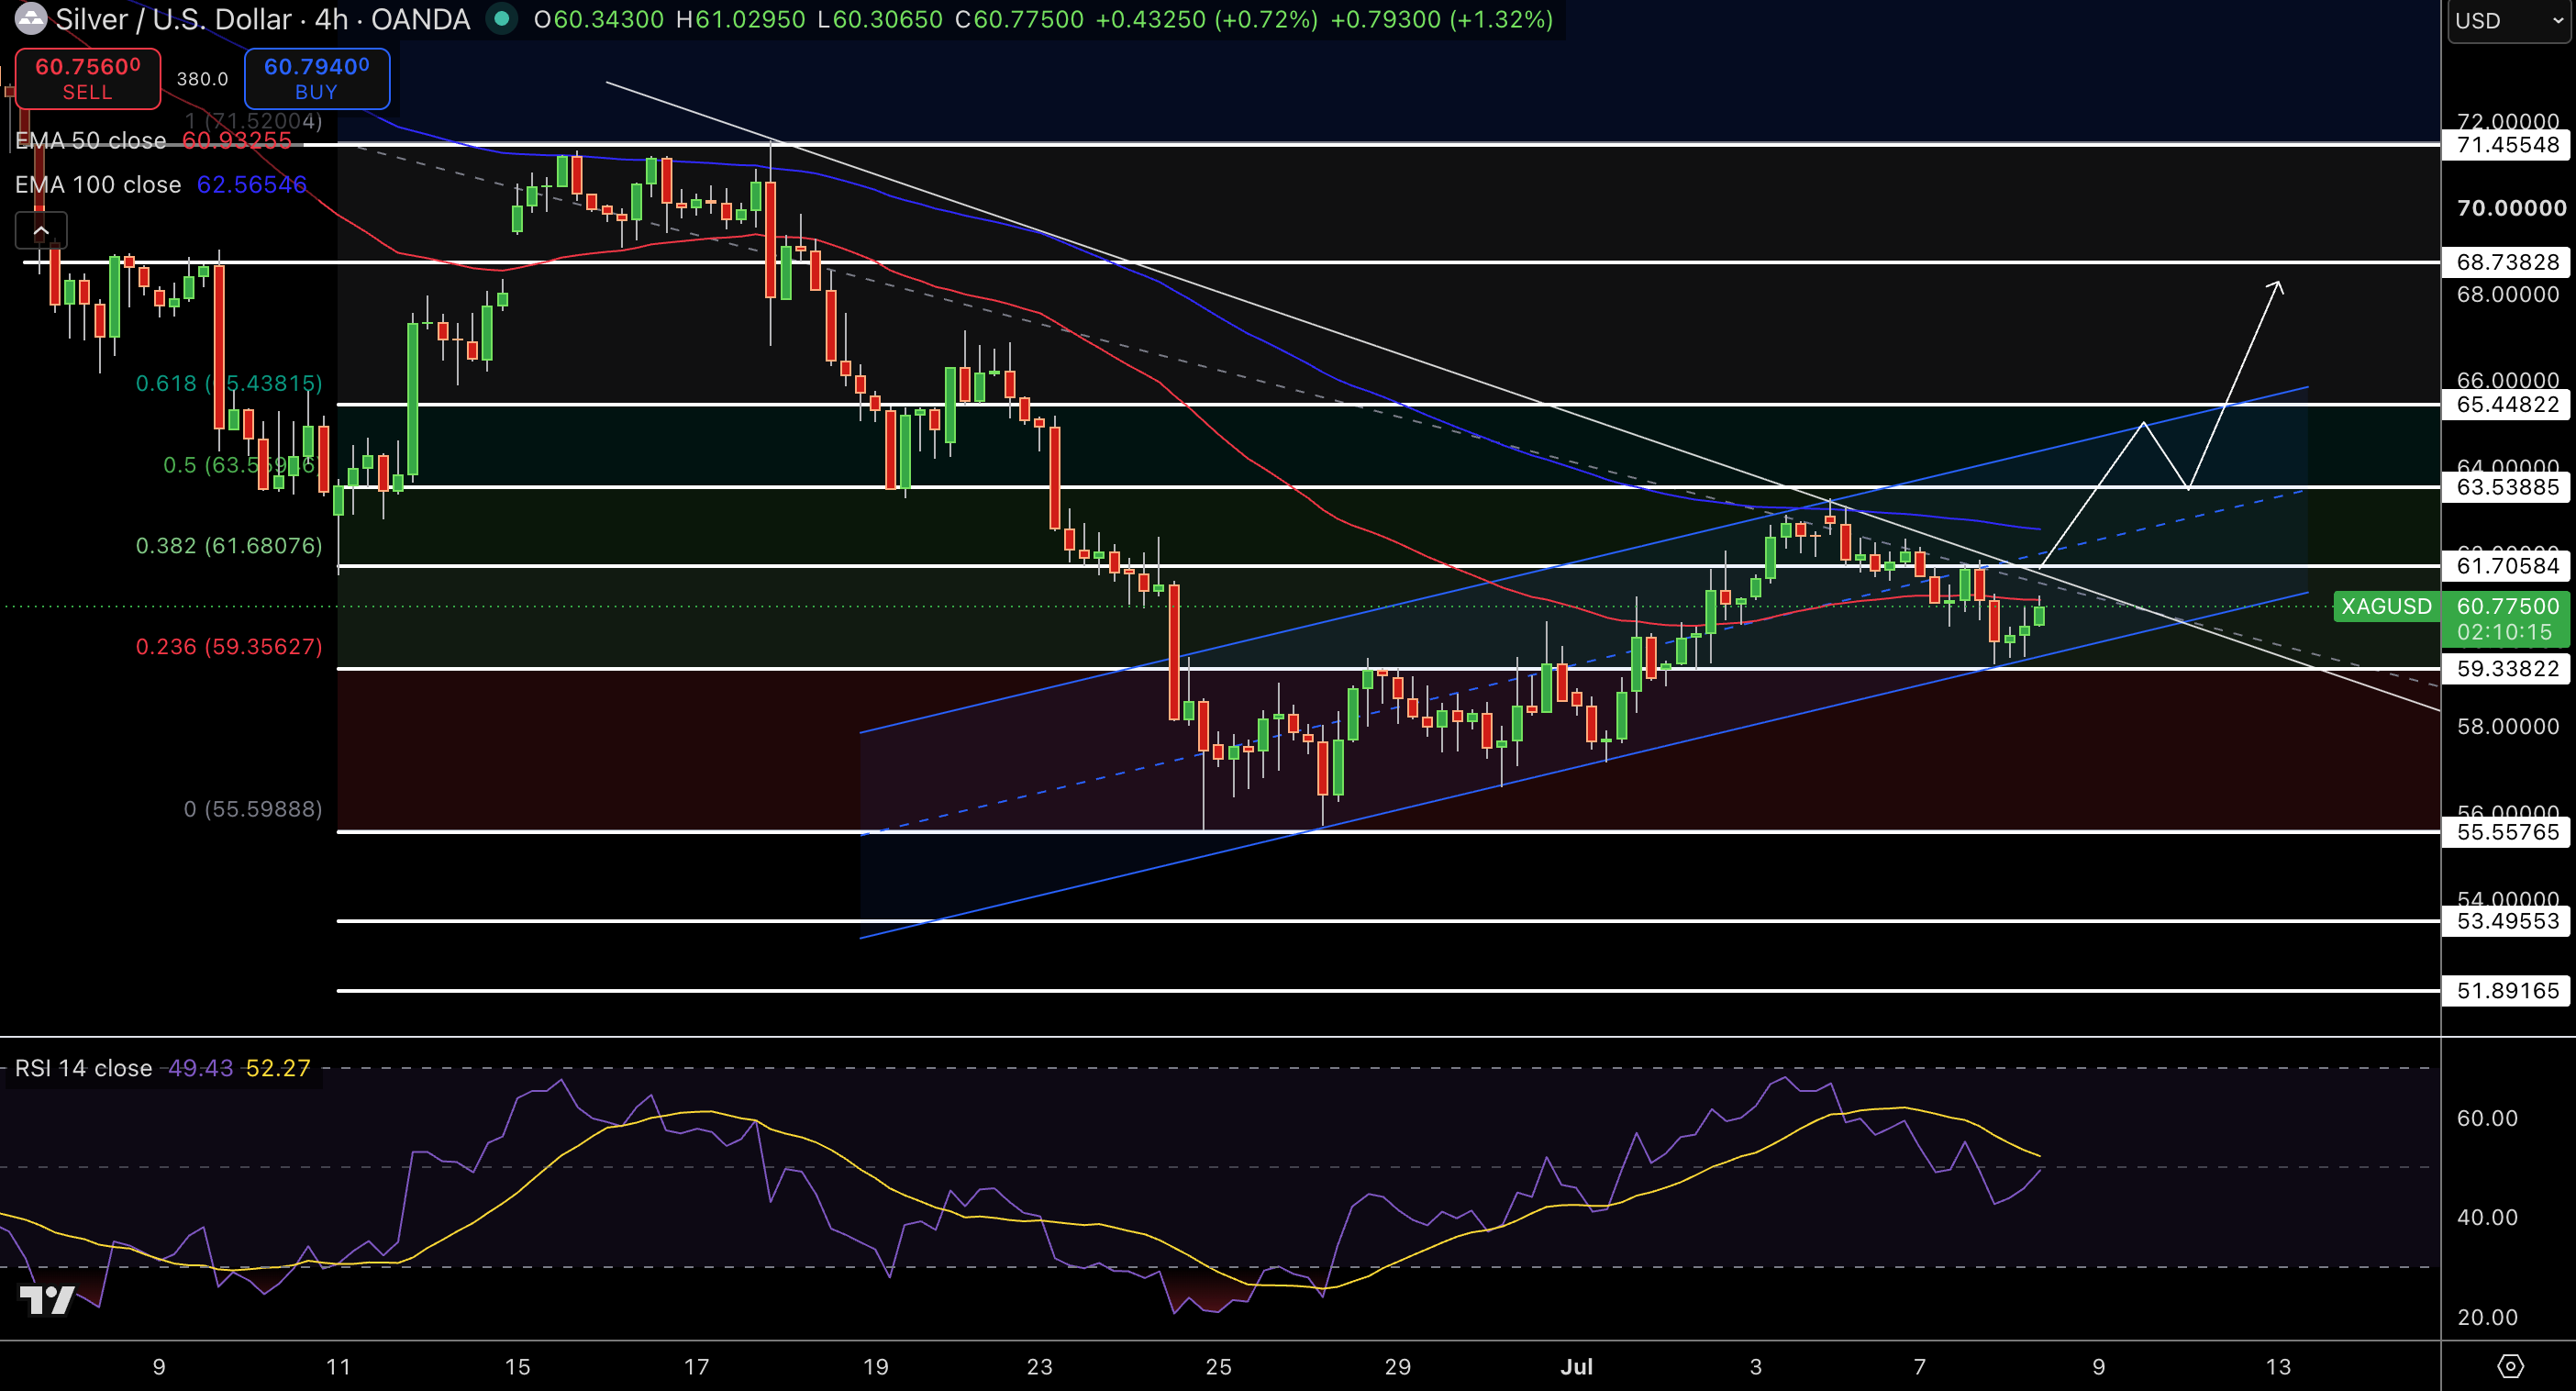
Silver trades at $60.78 with the 4-hour chart showing the 0.618 Fibonacci level at $63.44 on green rebound candles. Silver retraced down to this Fibonacci level following a sharp decline from the $69.85 high. From a $57.51 swing low, silver has been making a series of higher lows and bullish rejection wicks, indicating buyers stepping in on the support level.
Gold Price Forecast
Every new Gold analysis as it publishes, today's technical signal and key levels, live price — on one page.
See all Gold forecastsThe RSI is sitting at 49, suggesting neutral momentum. A volume profile fair value cluster is forming on a $59 to $61 zone, as silver looks to test the $61.71 to $63.33 zone. The structure remains neutral to bullish above the 50-period EMA, despite the broader downtrend. Higher lows keep the bulls in the trades on dips.
Trade Idea: Buy $60.78, targeting $61.71, with a stop at $59.00.