Iran Strikes Rattle Futures Ahead of Fed Minutes
S&P 500 futures slipped 14.75 points, or 0.20%, to 7,536.50 at 07:22 GMT Wednesday while Dow futures dropped 192 points, or 0.36%, to 53,005. Nasdaq futures fell 77.25 points, or 0.26%, to 29,314.25, with overnight semiconductor selling in Asia adding directional pressure.
CENTCOM struck Iranian targets overnight and crude jumped above $71. The inflation trade is back on right before the Fed’s June minutes come out this afternoon.
The chip selling out of Seoul is the other side of the problem. South Korea’s Kospi entered bear market territory on semiconductor losses and Nasdaq futures are catching the same rotation this morning. Hong Kong was the one bright spot in Asia. The Hang Seng gained 3.18% while Japan’s Nikkei 225 fell 2.11% and the Topix declined 1.37%.

Ceasefire Took a Direct Hit Overnight
Three commercial vessels were attacked transiting the Strait of Hormuz and CENTCOM answered with what it described as “a series of powerful strikes.” The statement called Iran’s aggression “unwarranted, dangerous, and a clear violation of the ceasefire.” Violation is the word. That’s a formal accusation the agreement is broken.
Treasury pulled the oil export license it granted Iran during the talks. Those barrels are off the table if the revocation holds. August WTI climbed 5.38% to $74.30 in Asian trading. September Brent rose 5.47% to $78.22.
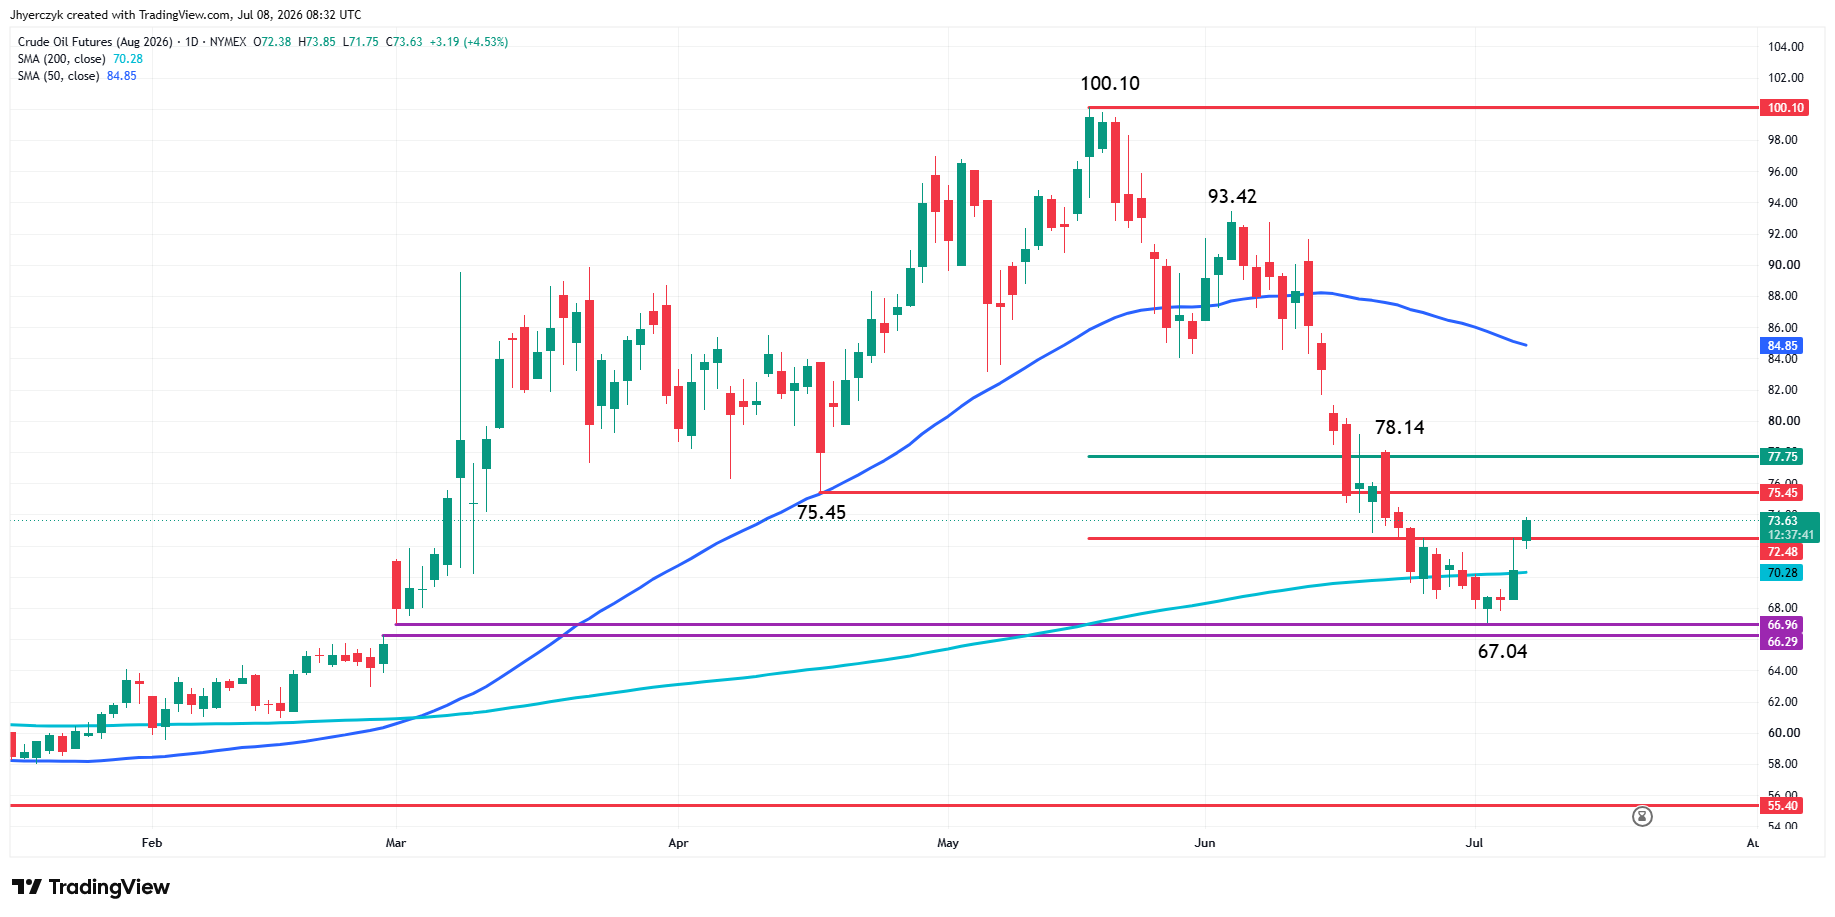
That puts crude above $71 heading into the Fed minutes this afternoon. Warsh has already made clear that prices are the only thing he’s watching.
Chip Selling Crashed Korea Into Bear Territory
Seoul took the worst hit overnight. The Kospi fell more than 5% Wednesday into an official bear market, sitting 20% below its June 19 record high, and the damage was almost entirely concentrated in semiconductors. Samsung Electronics dropped nearly 6%. SK Hynix gave back about 4%. The two companies represent more than 40% of the Kospi, so when chips sell, the index has nowhere to go.
NASDAQ 100 Price Forecast
Every new NASDAQ 100 analysis as it publishes, today's technical signal and key levels, live price — on one page.
See all NASDAQ 100 forecastsThe selling was aggressive enough to trigger a sidecar halt on the Korea Exchange, briefly pausing sell-side program trading. Tuesday’s Wall Street session already showed the same rotation out of AI-related names, and Nasdaq futures this morning confirm the semiconductor weakness is not limited to Seoul.
Warsh’s Silence Makes These Minutes the Event
The June 16-17 FOMC minutes land this afternoon and carry more weight than usual because Chair Kevin Warsh gave almost nothing at the post-meeting press conference. No forward guidance. No hints about July.
“The FOMC minutes will be a wildcard simply because Warsh was so opaque at the most recent press conference,” Vital Knowledge founder Adam Crisafulli said.
The committee held at 3.50% to 3.75% for the fourth straight meeting but kept hikes on the table.
“We recognize that inflation has been running well ahead of the Fed’s long-stated inflation goal of 2 percent,” Warsh said. “Persistently high prices are a burden for the American people. But the recent past need not be prologue.”
The complication is timing. These minutes capture what policymakers believed before June’s payrolls report, which showed only 57,000 jobs added. Traders have to separate what the committee was saying three weeks ago from how the economy looks now.
Dow Reversal Top Opens Door to Correction
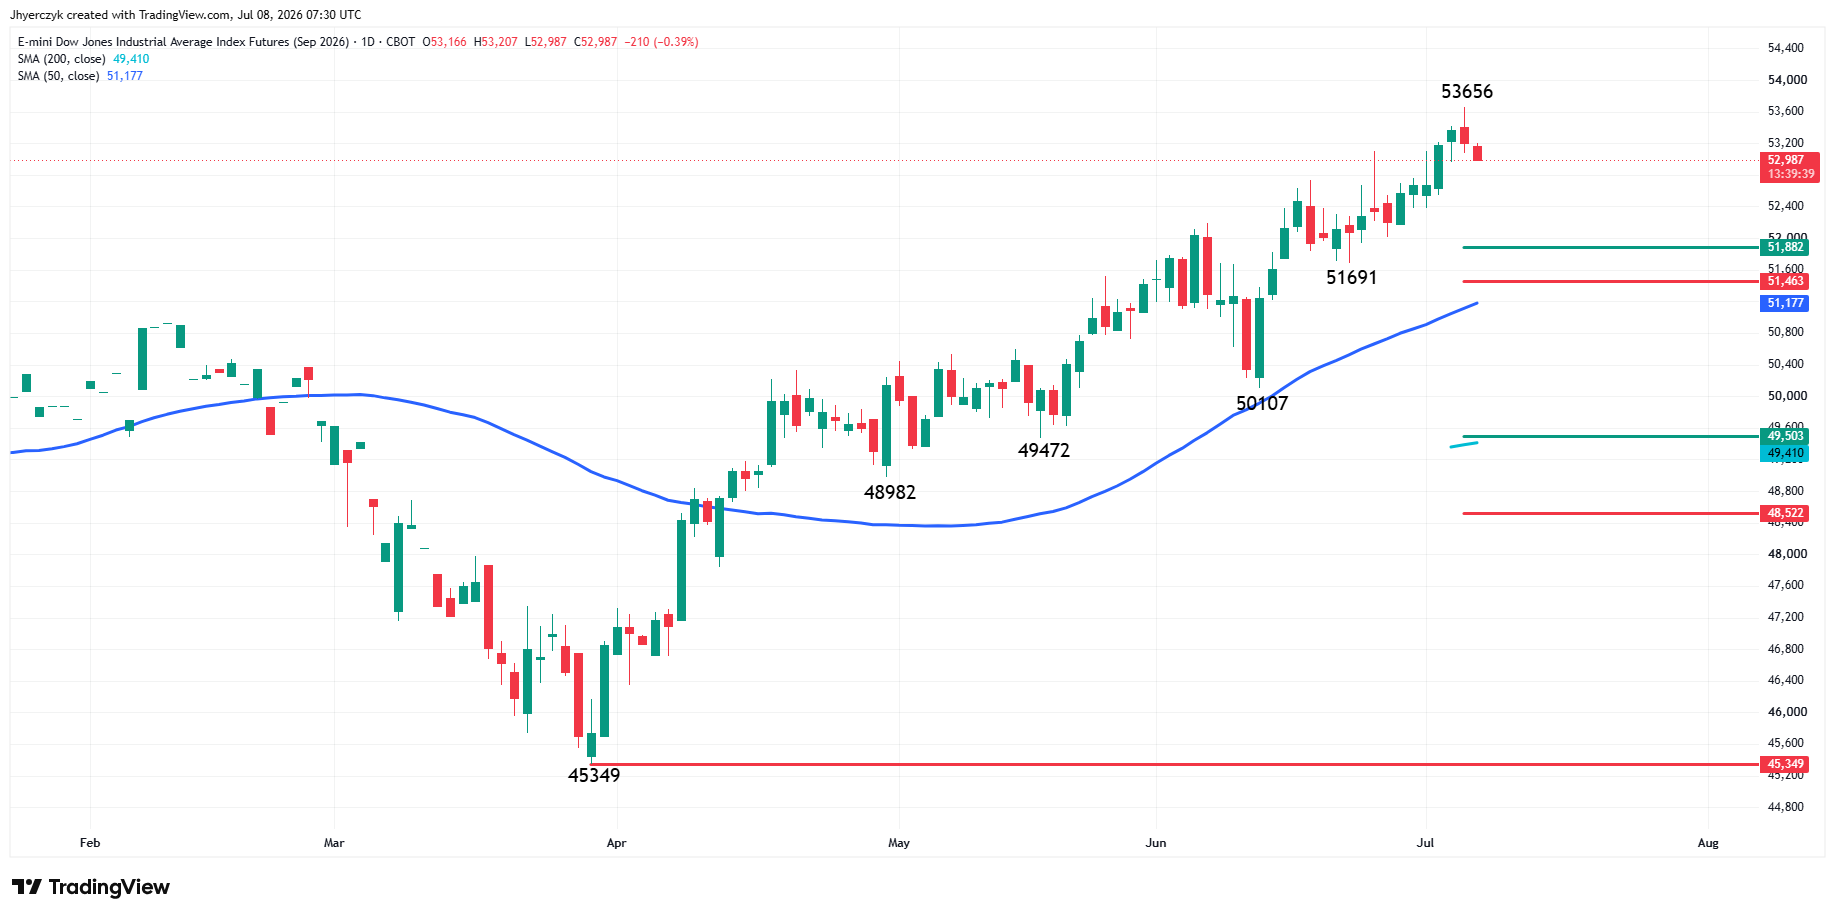
September E-mini Dow Jones futures are edging lower early Wednesday after confirming yesterday’s closing price reversal top. The chart pattern doesn’t change the trend to down, but it could lead to a 2 to 3 day correction. The first downside target is the retracement zone at 51882 to 51463.
A trade through 51691 will change the minor trend to down and shift momentum to the downside. Crossing to the weak side of the 50-day moving average at 51178 will reaffirm the momentum shift. The main trend will change to down on the daily swing chart if 50107 fails as support.
On the upside, a trade through the record high at 53656 negates the closing price reversal top, signaling a resumption of the uptrend.
Nasdaq-100 Leaning Below the 50-Day
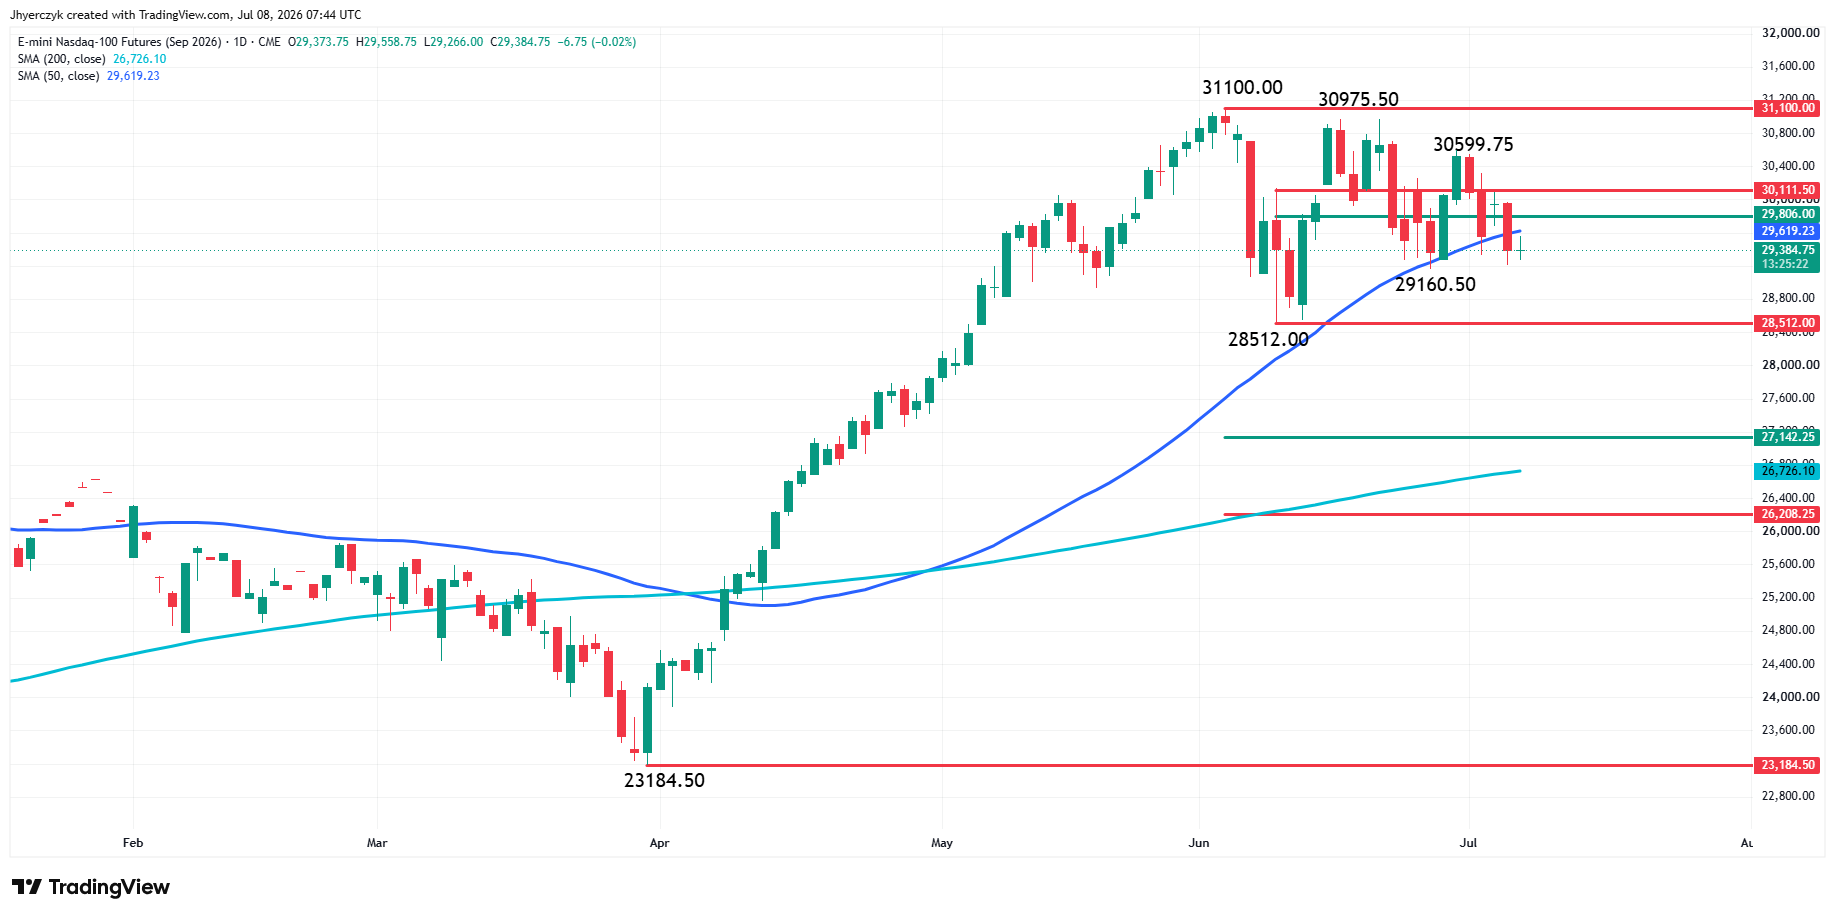
September E-mini Nasdaq-100 Index futures are weaker early Wednesday, but the index is trading inside yesterday’s range. This means traders haven’t made up their minds on the direction of the daily trend.
Yesterday’s close and today’s opening under the 50-day moving average at 29618.55 has me leaning to the downside.
Taking out the swing bottom at 29160.50 will indicate the selling is getting stronger. This could trigger a further break into the main bottom at 28512.00. This is a potential trigger point for an acceleration to the downside. The major downside target is the long-term retracement zone at 27142.25 to 26208.25. Inside this area is the 200-day moving average at 26726.00.
On the upside, overcoming the 50-day MA will indicate sellers are lightening up. This could trigger a rally into the short-term retracement zone at 29806.00 to 30111.50. Closing on the strong side of this zone will put the index in a position to challenge the secondary top at 30599.75.
S&P 500 Holding Key Support Cluster
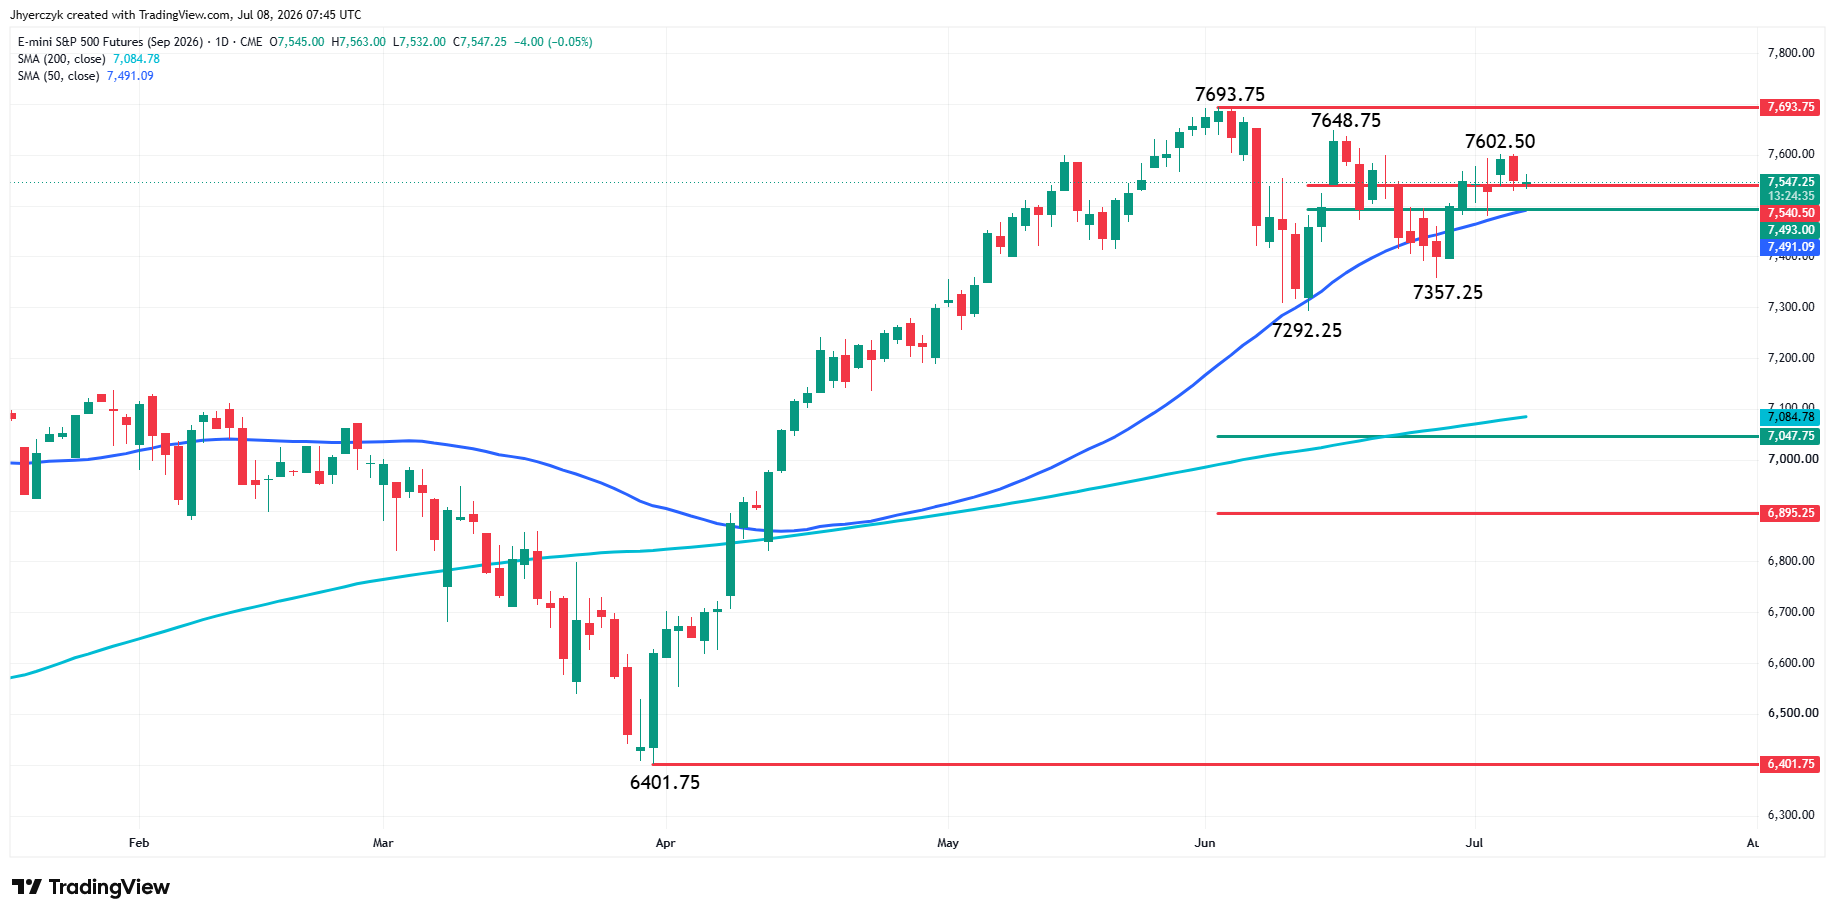
September E-mini S&P 500 Index futures are slightly lower early Wednesday but holding up remarkably well above the short-term Fibonacci level at 7540.50, the short-term 50% level at 7493.00 and the 50-day moving average at 7491.02.
The key area to watch today is the support cluster formed by the 50% level at 7493.00 and the 50-day MA at 7491.02. If this fails as support, prices could plunge into the secondary higher bottom at 7357.25, followed by the June 11 main bottom at 7292.25.
The latter is the last potential support before the 200-day MA at 7084.75 and the long-term retracement zone at 7047.75 to 6895.25.
If I had to rank the majors, the Dow is strong but cautious today, the S&P 500 is also cautious with a lean to the downside because of its tech holdings, and the Nasdaq is weak because of the influence of the semiconductor sector.
What to Watch
Oil is running this morning and the minutes haven’t even dropped yet. Crude above $71 reopens the inflation question on the same day traders find out how many Fed officials were pushing for a hike three weeks ago. The semiconductor wreck in Seoul landed squarely on the names that carry the Nasdaq. If U.S. chip stocks open weak, the tech index loses the sector that has been doing all the work.
The three indices are telling different stories right now. The Dow printed a reversal top but the structure underneath is still intact. The S&P 500 is sitting right on top of the 50-day moving average. The Nasdaq-100 is already below it. That split says rotation, not liquidation, but 7,491 on the S&P 500 is the number that decides whether the selling stays contained.
More Information in our Economic Calendar.