



The Dollar Is Back at Pre-Tariff Highs
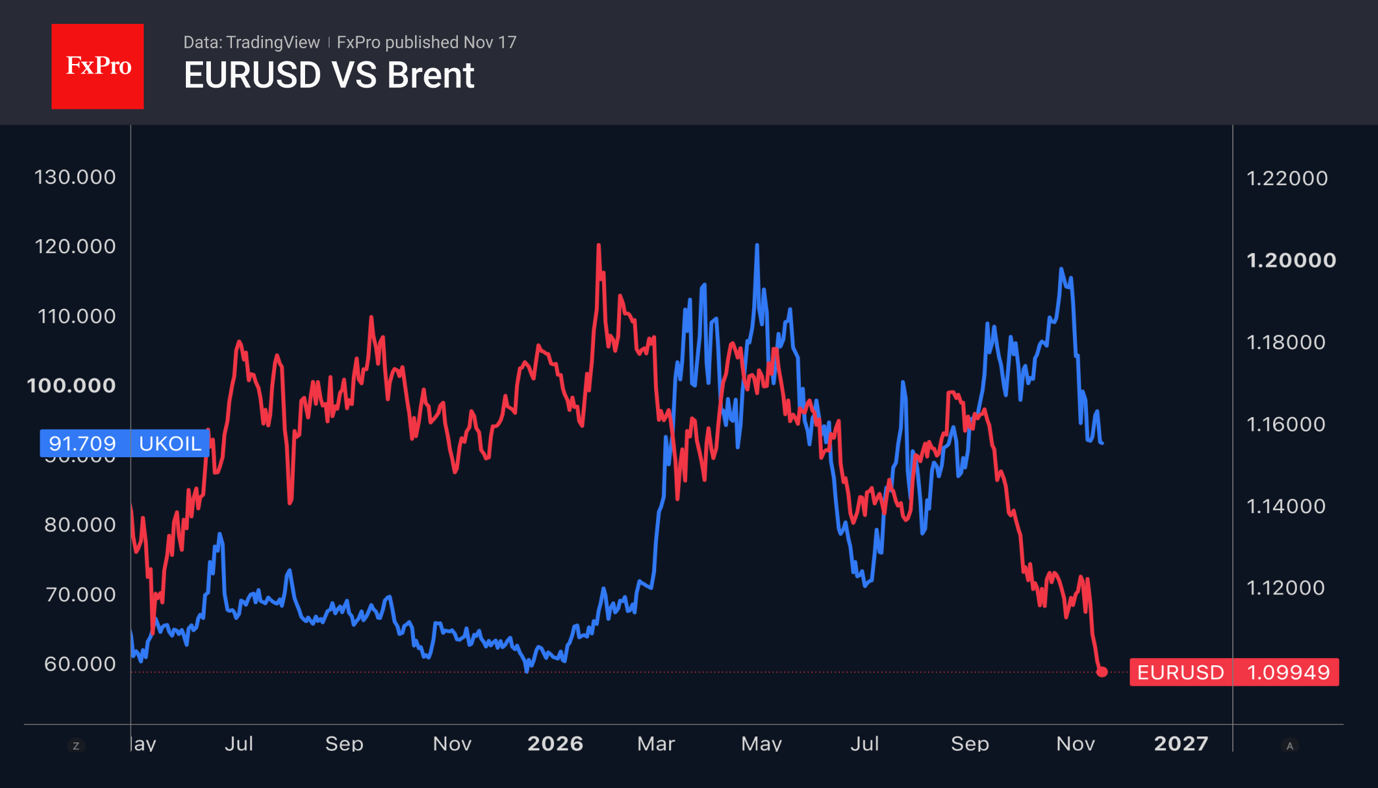
The US dollar has returned to highs last seen before Donald Trump imposed large-scale tariffs. At that time, it was believed that import duties would slow the economy, as they would weigh on US companies and households, forcing the Fed to cut rates. At the same time, mistrust of the White House’s policies triggered a capital outflow from the US securities market. In reality, the opposite happened.
The boom in artificial intelligence companies brought non-residents back to buying US stocks, and the US economy picked up steam. The rise in oil prices triggered by the conflict in Iran forced the Fed to shift from easing monetary policy to tightening it. The dollar dominates the forex market, and even the latest drop in oil prices is not helping EURUSD.
Oil Trades on Supply, Not Headlines: The Surplus Is Back
The oil market has stopped paying attention to geopolitical headlines and has begun trading based on actual supply. Investors have finally acknowledged that supply is outpacing demand, which plays into the bears’ hands.
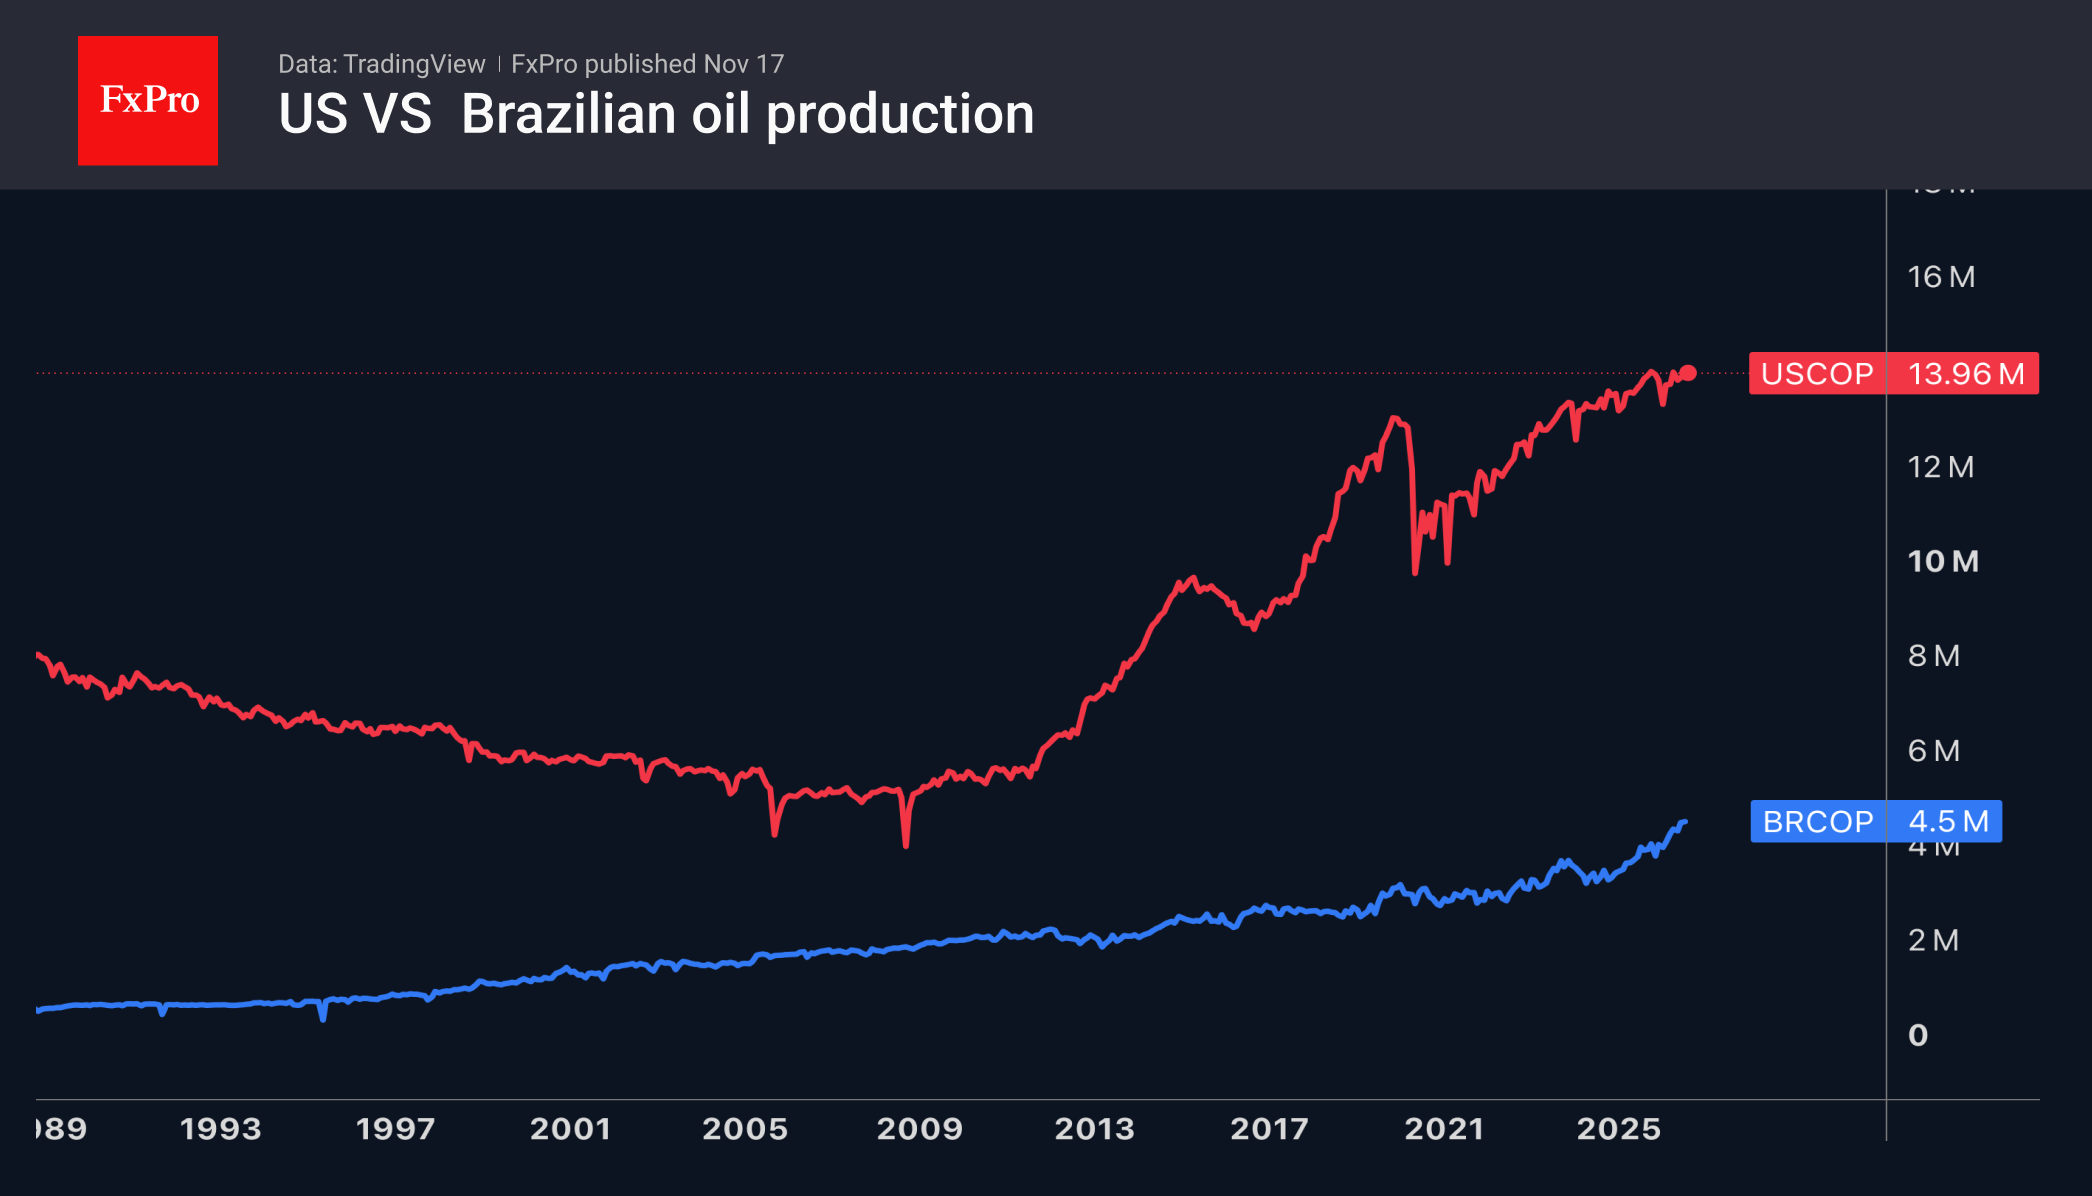
Goldman Sachs forecasts a surplus of 2 million barrels per day in 2027, as Middle Eastern producers restore production to previous levels and high prices curb demand. In addition, supply is growing elsewhere, first and foremost in Brazil. Meanwhile, according to the latest reports, Saudi Arabia has increased production to 10.5 million barrels per day. There are also reports of a significant increase in production in Iraq and Kuwait. Combined with consistently high US production of 14 million barrels per day, this creates a bearish market environment. The bank forecasts that Brent will average $88 per barrel next year, falling to $78 by year-end.
JPMorgan believes the oil market has already returned to a surplus. The bank estimates the surplus at 1.1 million barrels per day in September and 1.4 million barrels per day in October. The IEA expects the market to return to balance by the end of this year, as the growth in exports is outpacing the recovery in demand. Without an escalation of the conflict, the surplus could grow to 3.8 million barrels per day by the end of 2027.
Prices are under pressure following reports that China has resumed building up its oil stockpiles for the first time since July. This was driven by a recovery in imports and weak refining volumes. According to Reuters estimates, refineries processed 490,000 barrels per day less in October than they could have, given imports and domestic production.
Separately, oil is being weighed down by a strengthening dollar and pressure in the stock market, which is dampening risk appetite.
Brent Oil Price Forecast
Every new Brent Oil analysis as it publishes, today's technical signal and key levels, live price — on one page.
See all Brent Oil forecastsBrent at the 200-day Average: $85 Is the Line That Confirms a Reversal
Since the start of last week, Brent has been trading near its 200-day moving average. Although it does not serve as a strict support or resistance level, it provides a good indication of the market regime: the market remains bullish but is currently undergoing an important test of its strength. From May 2024 to January 2026, rallies above this curve quickly attracted sellers, while since February 2026, dips below this line have spurred buying activity. If technical factors come into play alongside the fundamentals, the price decline could be quite rapid; however, to avoid ending up on the wrong side of the trend, in our view, it would be wiser to wait for confirmation of a reversal in the form of a Brent drop below the most recent significant lows near $85 per barrel.
Crypto: A Fragile Consolidation Near $2.20T
The crypto market capitalisation has remained close to the $2.20T mark for the third day running, while the entire market remains firmly in the grip of the bears, who prevented a rebound from taking hold on Monday. In other markets, the Nasdaq-100’s nearly 3% decline has not been followed by a rebound, while the US Dollar Index is trading near 19-month highs after a five-day rally, with no signs of a trend reversal.
The only signal to the contrary is a decline in the probability of a 50-basis-point Fed rate hike in December from 14.5% on Thursday to 5% as of 07:00 GMT, according to CME FedWatch. The positive trend seen in altcoins at the start of the day on Monday did not hold. Still, by the start of active trading in Europe on Tuesday, coins were once again predominantly showing gains over the past 24 hours, with the ratio of gainers to losers standing at approximately 4:1. The top gainers are Internet Computer (+10%), Basic Attention Token (+6.8%) and Hyperliquid (+4.6%). The biggest fallers are Hedera (-2.9%), Stellar (-1.3%) and Ethereum Classic (-1.1%).
Bitcoin Stuck at $64–65.5K, with $58K Still the Downside Risk
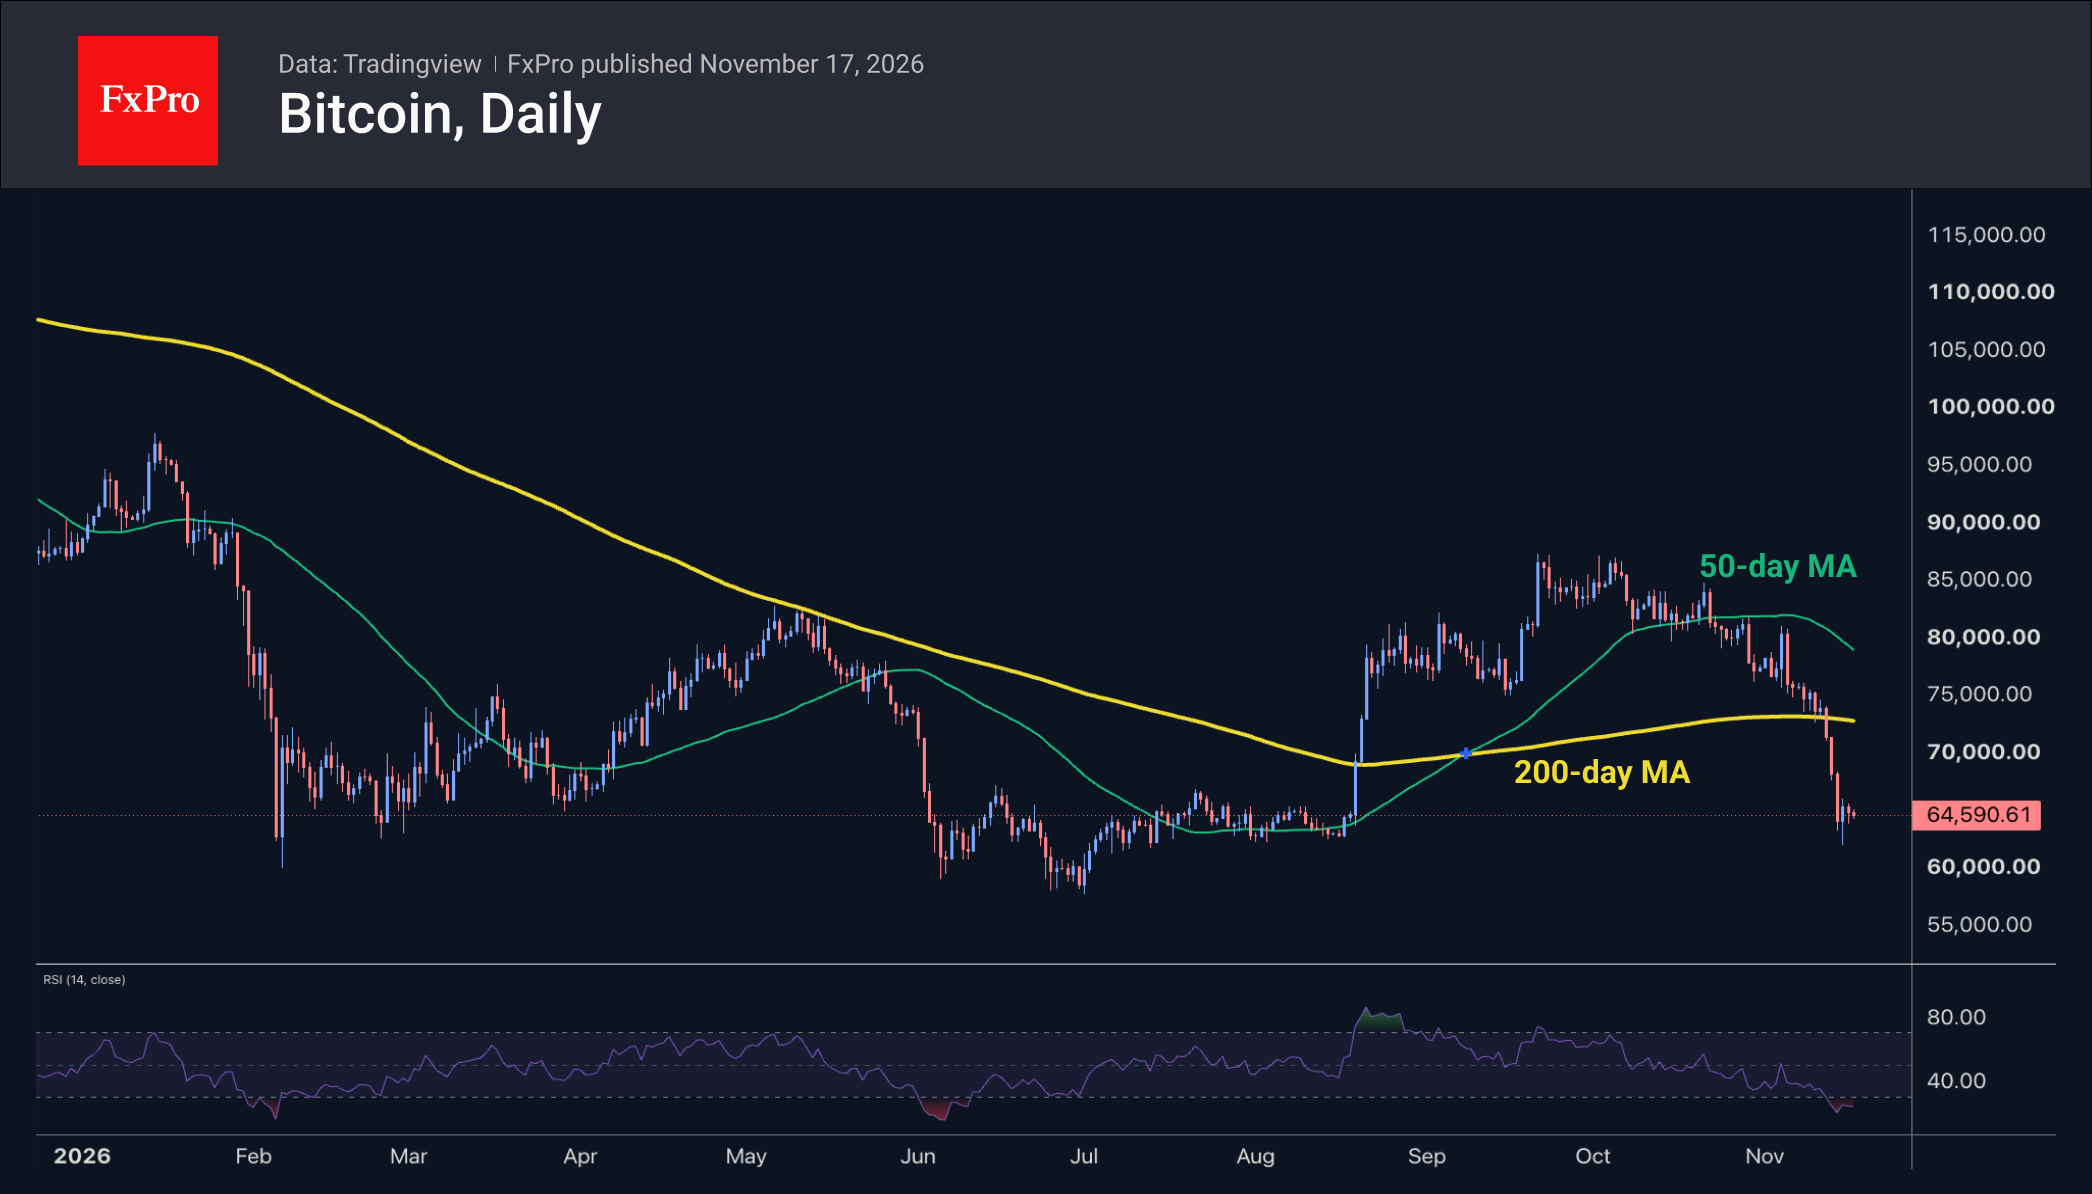
Bitcoin is trading near $64.5K, having remained largely within the $64–65.5K range since the start of the week. Traders hoping for a quick rebound cannot help but be concerned that the day has started with a decline, albeit a relatively modest 1.2% so far, as such a brief consolidation could well be followed by a fresh leg lower. Perhaps this time, the market will need a shift in global risk appetite to bring buyers back to Bitcoin, with altcoin speculators following suit.
Ethereum Bounces Off Three-Year Support, but $1,500 Is in Play
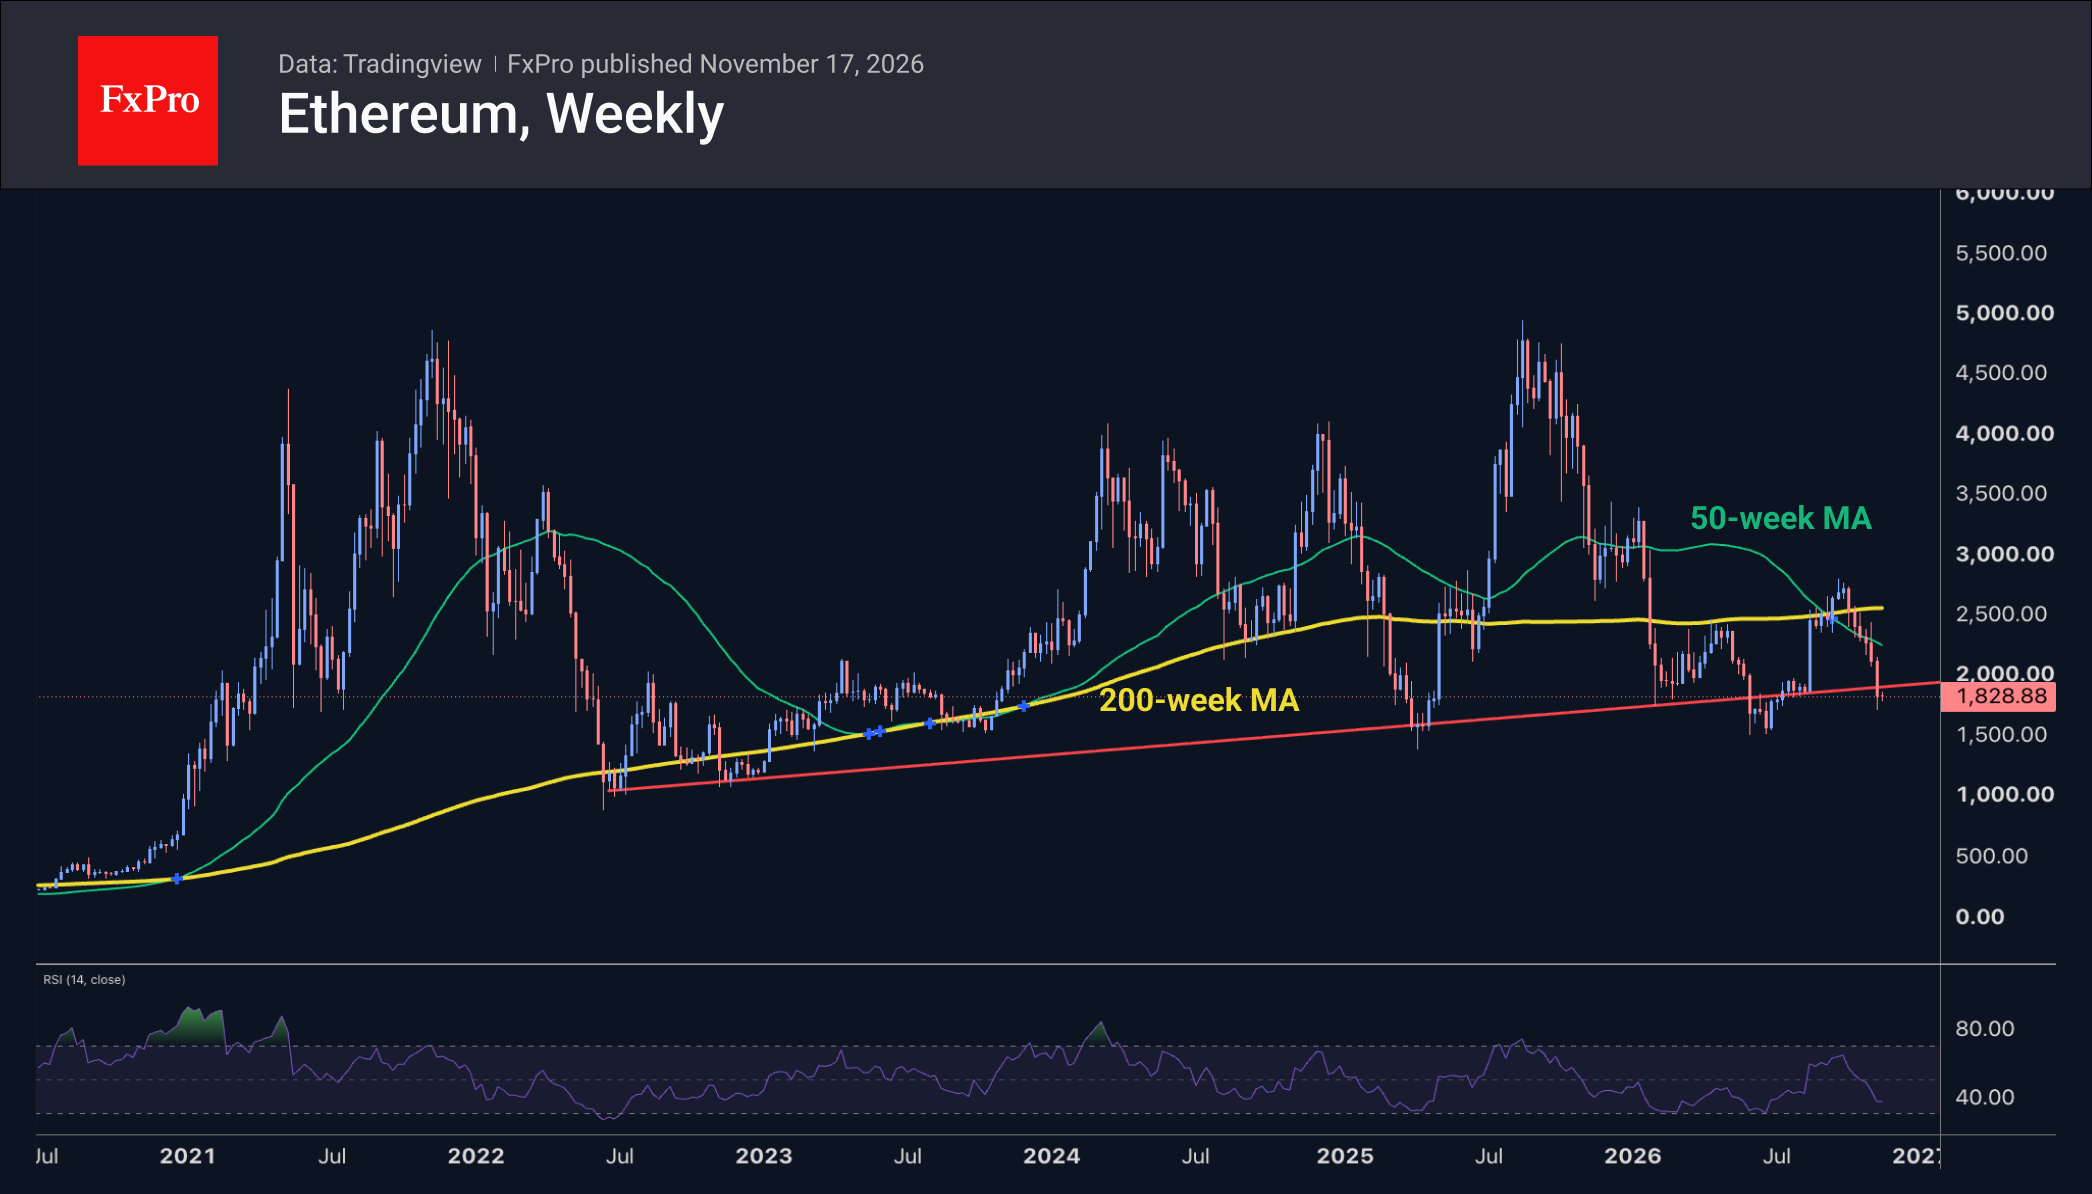
However, Ether‘s performance is taking some of the drama out of the situation, as the second-largest and most influential cryptocurrency is trading at $1,825, up 6.9% from Sunday’s lows. A return to the support zone seen over the last three years has attracted buyers, an important positive indicator of sentiment across all cryptocurrencies, suggesting that there remains deep-seated interest in buying on dips. However, support for ETH looks rather weak right down to $1,500. In other words, the coin could well slip towards this year’s and last year’s lows in the event of a fresh sell-off, before buyers signal their interest.
What to Watch
Base case for oil: in our view, the oil market is shifting into surplus, but the bullish regime remains intact as long as Brent holds near its 200-day moving average and above $85. Risk and invalidation: a Brent drop below $85 would confirm a bearish reversal; the risk for the bears is a fresh escalation in the Middle East.
Base case for crypto: in our view, without an improvement in global risk appetite, the consolidation remains fragile, and the risk of a fresh leg lower outweighs the chances of a rebound. Risk and invalidation: a rise in Bitcoin above $66K would put the rebound scenario back on the table, while a move below $64K would signal a further fall towards $58K. For ETH, the risk is a slide towards $1,500.
Upcoming: NVIDIA earnings on 17 November after the market close; US crude inventories from the EIA on 18 November at 15:30 GMT; the FOMC minutes on 18 November at 19:00 GMT; Anthropic’s IPO on 18 November, with trading starting on 19 November.
This article is for information only and is not investment advice. Trading CFDs, forex, stocks and cryptocurrencies carries a high risk of losing money; past performance is no guide to future results.