NASDAQ 100 Technical Analysis
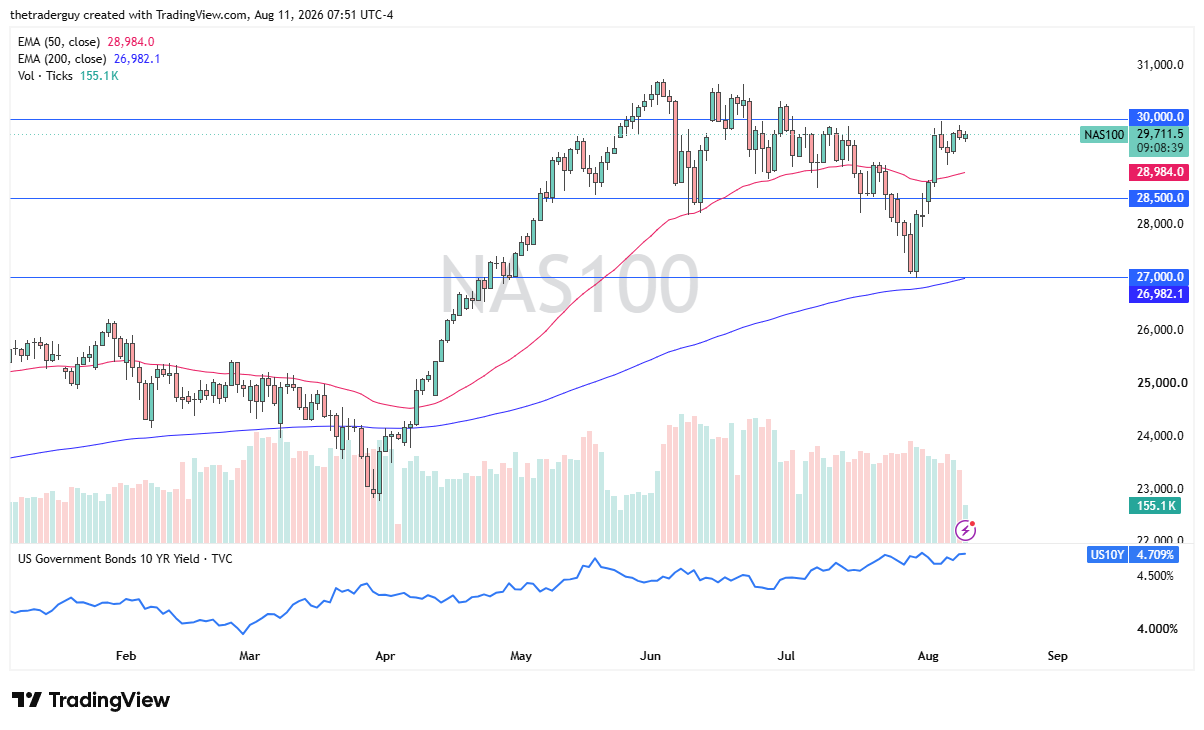
The Nasdaq 100 has rallied slightly in pre-market trading here on Tuesday as we continue to see a little bit of noisy action just below the 30,000 level. If we were to break above the 30,000 level, then the market could go looking to the upside, perhaps trying to challenge the 30,700 level again if momentum can carry it towards those all-time highs. Short-term pullbacks are possible here with the 50-day EMA underneath offering support. Breaking down below there could open up a move down to the 28,500 level, an area that has been important in the past.

Dow Jones 30 Technical Analysis
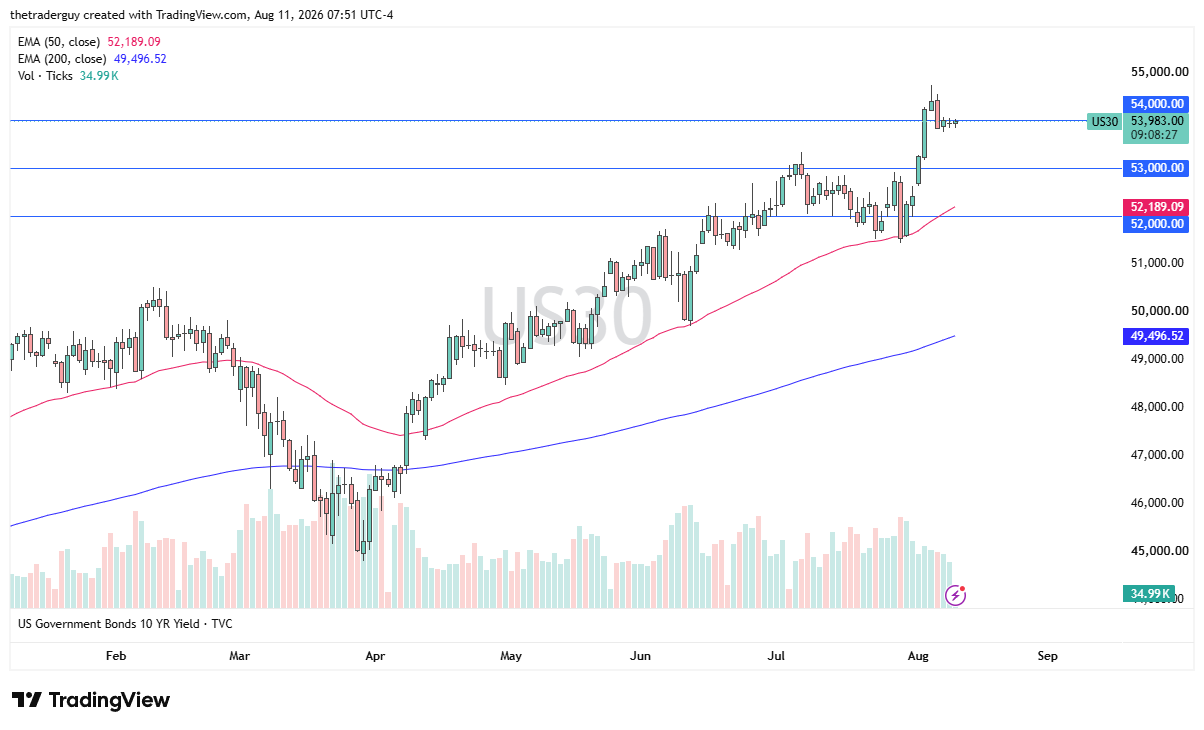
The Dow Jones 30 finds itself hanging around the 54,000 level again. This is an area over the last couple of days that’s been a bit of a magnet for price. It’s a large, round, psychologically significant figure, and over the last several months, it seems like every 1,000 points seems to be an area where the market starts to make decisions again. Regardless, it’s been very bullish to get up here; now we’re going sideways, working off some of the froth.
S&P 500 Technical Analysis
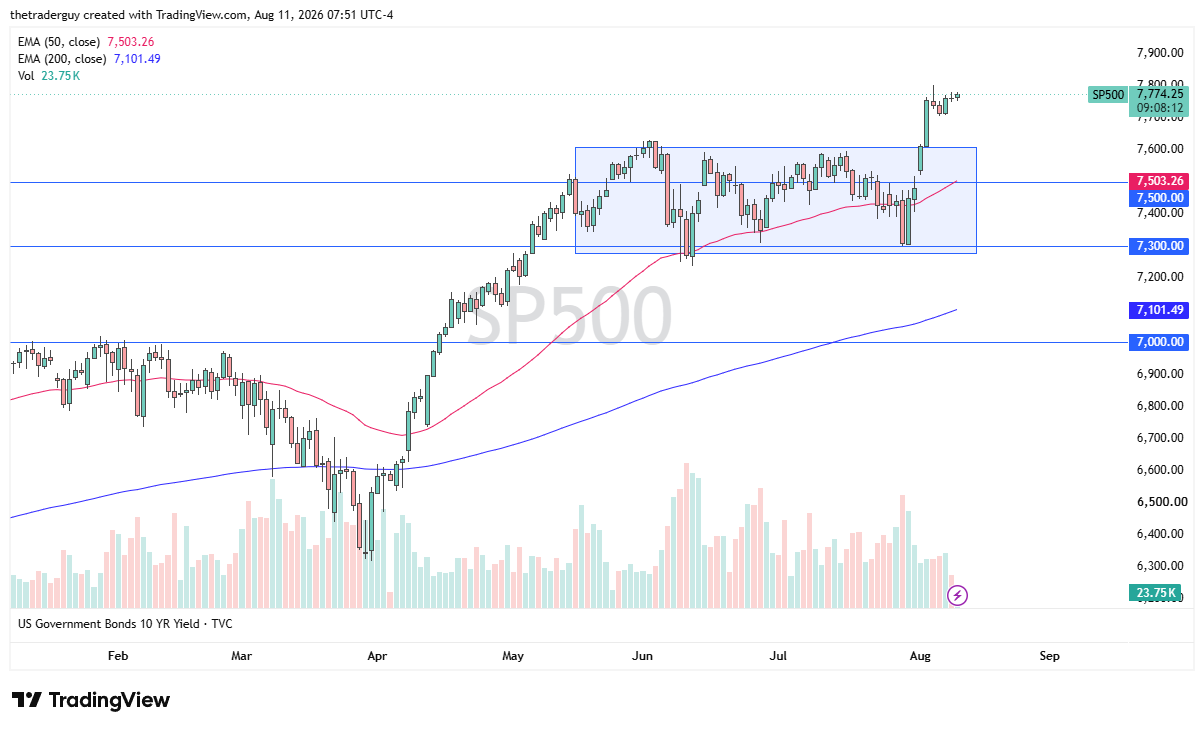
The S&P 500 looks like it’s going to be a little bit positive at the open, like it’s trying to get to the 7,800 level. The 7,800 level is a large, round, psychologically significant figure that offered resistance a few days ago. If we can clear there, that would be a bullish sign, and much like the Dow Jones 30, it looks like a market that is trying to build some kind of bullish flag. Either way, it’s most certainly a positive trend at the moment and therefore should be looked at through that prism.
If you’d like to know more about chart patterns and how to trade them, please visit our educational area.