


Bearish Reversal Confirms Seller Dominance
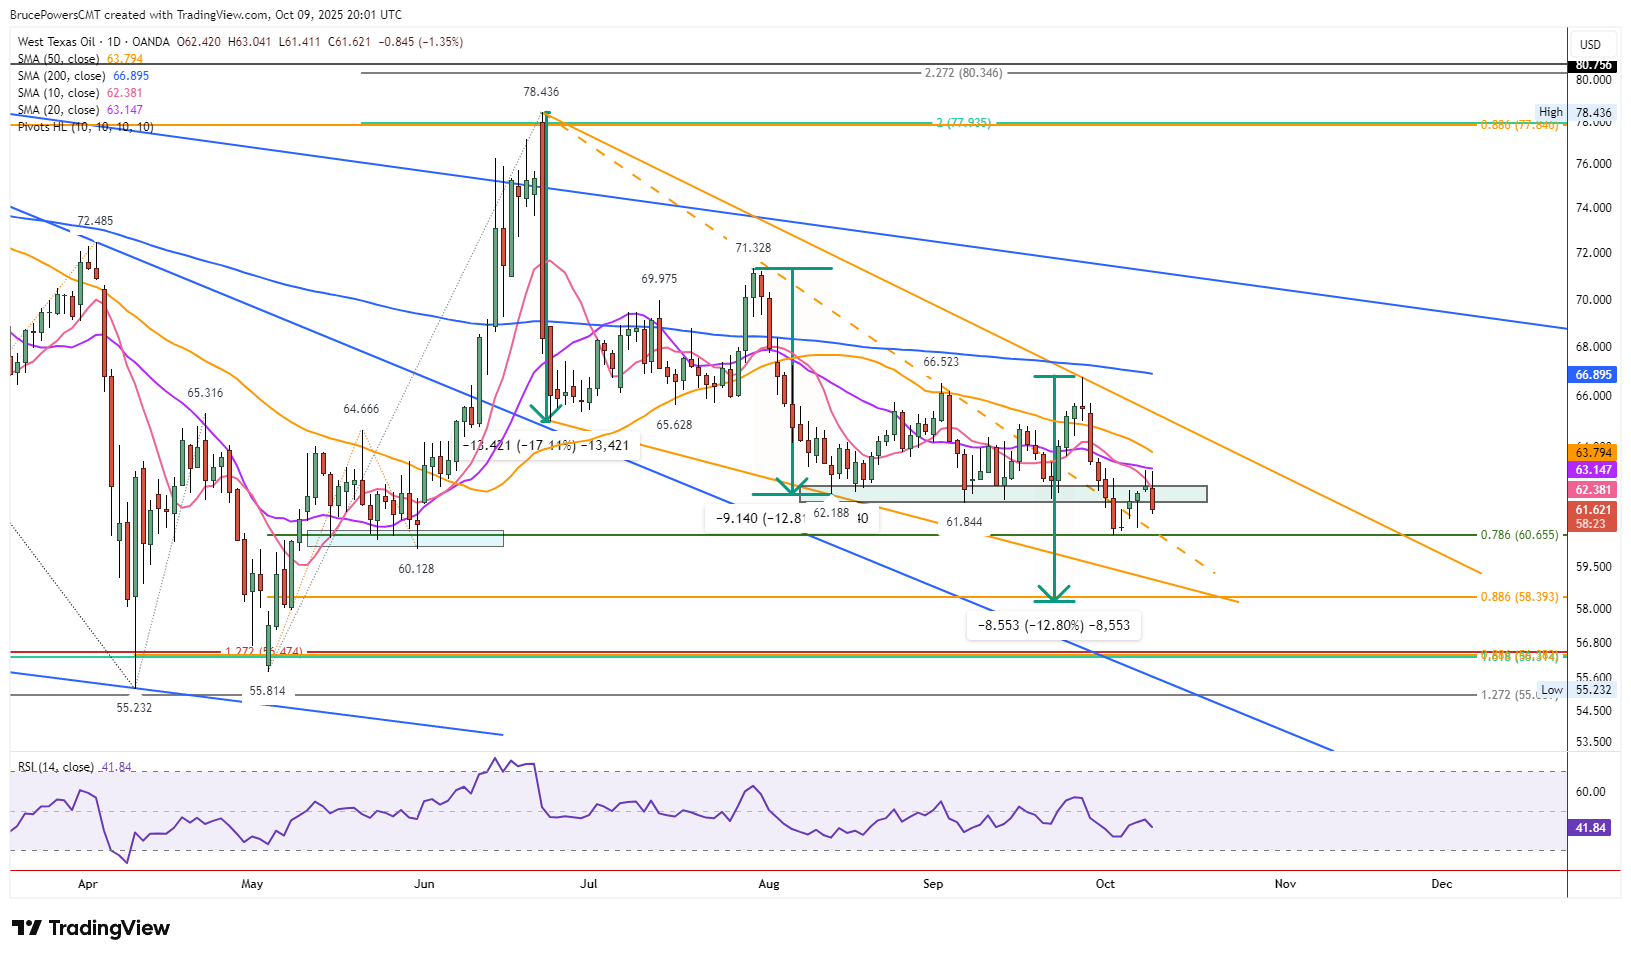
Crude oil extended its bearish slide on Thursday, reinforcing the downtrend that kicked off from June’s $78.44 peak. Sellers overwhelmed buyers after a second consecutive test of resistance at the 20-day moving average, with the day’s high stalling at $63.04. A shooting star candle triggered a one-day bearish reversal, with crude breaching Wednesday’s low of $63.09. As of now, prices linger near the session’s low at $61.41, reflecting aggressive selling. A daily close in this zone would solidify bearish conviction, adding weight to the case for further downside.
Momentum Shifts Toward Deeper Declines
Today’s action carved out another lower swing high, signaling potential acceleration in bearish momentum as the descent steepens. A break below the recent trend low of $60.64 would confirm the bearish trend’s continuation, opening the door to the next key target at $58.39—the 88.6% Fibonacci retracement of the rally from May’s swing low. This level marks a critical support zone, where buyers might attempt a stand.
The decisive breach of the 20-day average on September 29, followed by its rejection as resistance yesterday, underscores bearish control. This flip from support to resistance is classic bearish behavior, though a daily close below $61.50 is needed to cement the thesis.
Weekly Chart Reinforces Bearish Outlook
The weekly chart echoes the daily’s pessimism. This week’s high met resistance near the 10-week moving average, mirroring the daily’s 20-day line rejection. Last week’s wide-range bearish candle closed below an eight-week consolidation range, confirming a breakdown. Support briefly held at the 78.6% Fibonacci retracement, but yesterday’s lower swing high and this week’s likely inverted hammer candle—with a close near the weekly range’s lows—point to sustained selling pressure. These patterns suggest crude oil is poised for further weakness unless buyers can muster a defense.
Risks and Key Levels Ahead
The bearish scenario hinges on continued selling, with $60.64 as the immediate downside trigger and $58.39 in sight. However, a decisive rally above this week’s high of $63.09 would challenge the bearish setup, potentially signaling a reversal. For now, the 20-day average remains a formidable barrier. Watch Friday’s close for confirmation of the trend’s direction—bears hold the edge, but bulls aren’t out of the fight yet.
WTI Crude Oil Price Forecast
Every new WTI Crude Oil analysis as it publishes, today's technical signal and key levels, live price — on one page.
See all WTI Crude Oil forecastsFor a look at all of today’s economic events, check out our economic calendar.