


Bearish Momentum Accelerates Decline
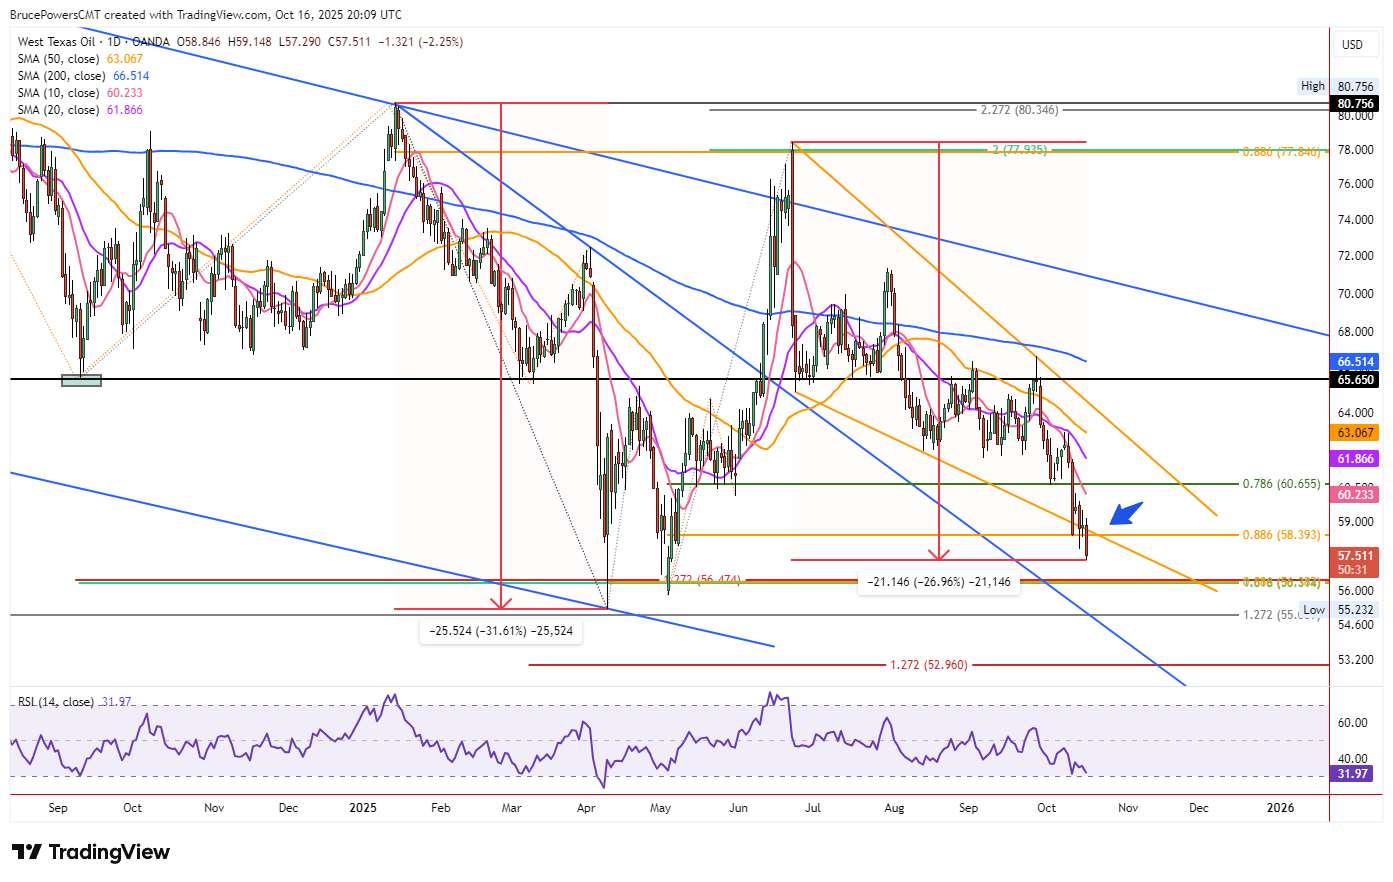
Bearish forces drove crude oil to a new corrective low of $57.29 on Thursday, etching a lower daily high and low. Trading hovers near the session’s bottom as of this writing, with a wide red candle signaling strong selling and a probable close in the lower end of the range. A finish below $57.77 would cement the bear trend’s continuation, unlocking lower targets amid evident downside conviction.
Support Failures and Extension Risks
The recent 88.6% Fibonacci retracement at $58.39 crumbled today, alongside the lower boundary of a potential falling bull wedge pattern. This dual failure hints at extended weakness, potentially mirroring April and May lows. A support confluence spans $56.47 to the $55.32 trend low, where buyers might emerge to halt the slide.
Rebound Potential and Resistance Levels
From the recent swing high of $66.77, the accelerated drop sets the stage for a sharp bullish snapback once support solidifies. Initial dynamic resistance aligns at the 10-day average and prior interim low around $60.79, with another floor at $61.84 possibly flipping to overhead pressure, joined by the 20-day average. The breached bull wedge’s upper downtrend line should cap upside, diminishing breakout odds in the expanded pattern.
Measured Decline and Pivot Target
Echoing the prior drop from January’s peak—a $25.52 (31.6%) plunge—a parallel dollar move points to $55.23, matching symmetries and marking a pivot. Proximity to April’s low bolsters this $55.23-$56.47 zone as a high-probability test area, where historical support could resurface.
Outlook and Key Levels
The wedge invalidation keeps bears in command, with $55.23 as a logical endpoint or turning point. Watch the close for confirmation; a sub-$57.77 print accelerates toward lows, while $60.79 hurdles any relief. Momentum favors sellers until support proves durable—April echoes loom large.
WTI Crude Oil Price Forecast
Every new WTI Crude Oil analysis as it publishes, today's technical signal and key levels, live price — on one page.
See all WTI Crude Oil forecastsFor a look at all of today’s economic events, check out our economic calendar.