Advertisement
Advertisement
Crude Oil Update – Spikes Higher on OPEC Compliance News
By:
U.S. April West Texas intermediate Crude Oil futures spiked higher shortly before the regular session opening as investors continued to react positively
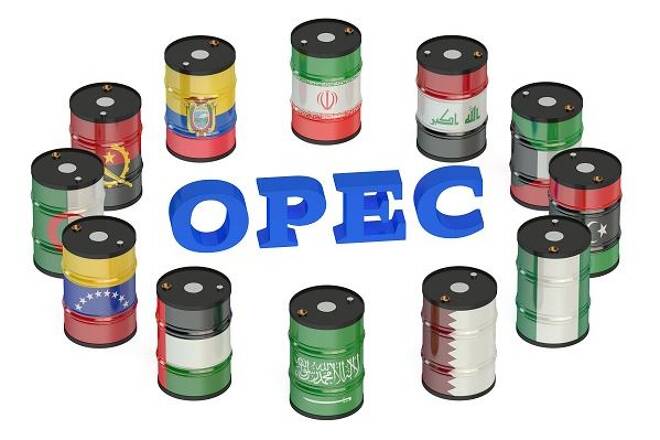
U.S. April West Texas intermediate Crude Oil futures spiked higher shortly before the regular session opening as investors continued to react positively to the news that OPEC is sticking with its plan to cut daily output and as investors become more optimistic about the plans success.
Traders are primary reacting to the news that OPEC Secretary General Mohammad Barkindo said January data showed conformity from participating OPEC nations without curbs had been above 90 percent and oil inventories would decline further this year.
“All countries involved remain resolute in the determination to achieve a higher level of conformity,” Barkindo said in a conference in London.
Traders may be ignoring the stronger U.S. Dollar’s impact on demand. News that hedge and commodity fund managers increased their long positions is also seen as a positive for prices although an overbought market may be vulnerable to sudden selling spikes.
Technical Analysis
The main trend is up according to the daily swing chart. The trend turned up on the trade through $54.55. The new main bottom is $53.12.
The next two upside targets are main tops at $54.96 and $55.16.
The main range is $56.92 to $51.86. Its retracement zone is $54.39 to $54.99. This zone is currently being tested. It has been controlling the direction of the crude oil market all year. Overtaking $54.99 will give the market a strong upside bias and a break back under $54.39 will shift momentum back to the downside.
Forecast
Based on the current price at $54.71, the direction of crude oil the rest of the session is likely to be determined by trader reaction to the long-term downtrending angle at $54.80.
Overtaking $54.80 will indicate the presence of buyers. This could lead to a fast rally into the Fib level at $54.99. Crossing the bullish side of this level will mean that the buying is strengthening. Look for a possible acceleration to the upside if $55.16 is taken out. This could lead to a test of the next angle at $55.86. This is the last potential resistance angle before the $56.92 main top.
A failure to overcome $54.80 will signal the presence of sellers. This could generate enough downside momentum to challenge the major 50% level at $54.39, followed by a pair of uptrending angles at $54.11 and $53.87.
Watch the price action and order flow at $54.80. Trader reaction to this angle will tell us if the bulls or the bears are in control.
About the Author
James Hyerczykauthor
James Hyerczyk is a U.S. based seasoned technical analyst and educator with over 40 years of experience in market analysis and trading, specializing in chart patterns and price movement. He is the author of two books on technical analysis and has a background in both futures and stock markets.
Advertisement
