



A Perfect Storm for the Dollar
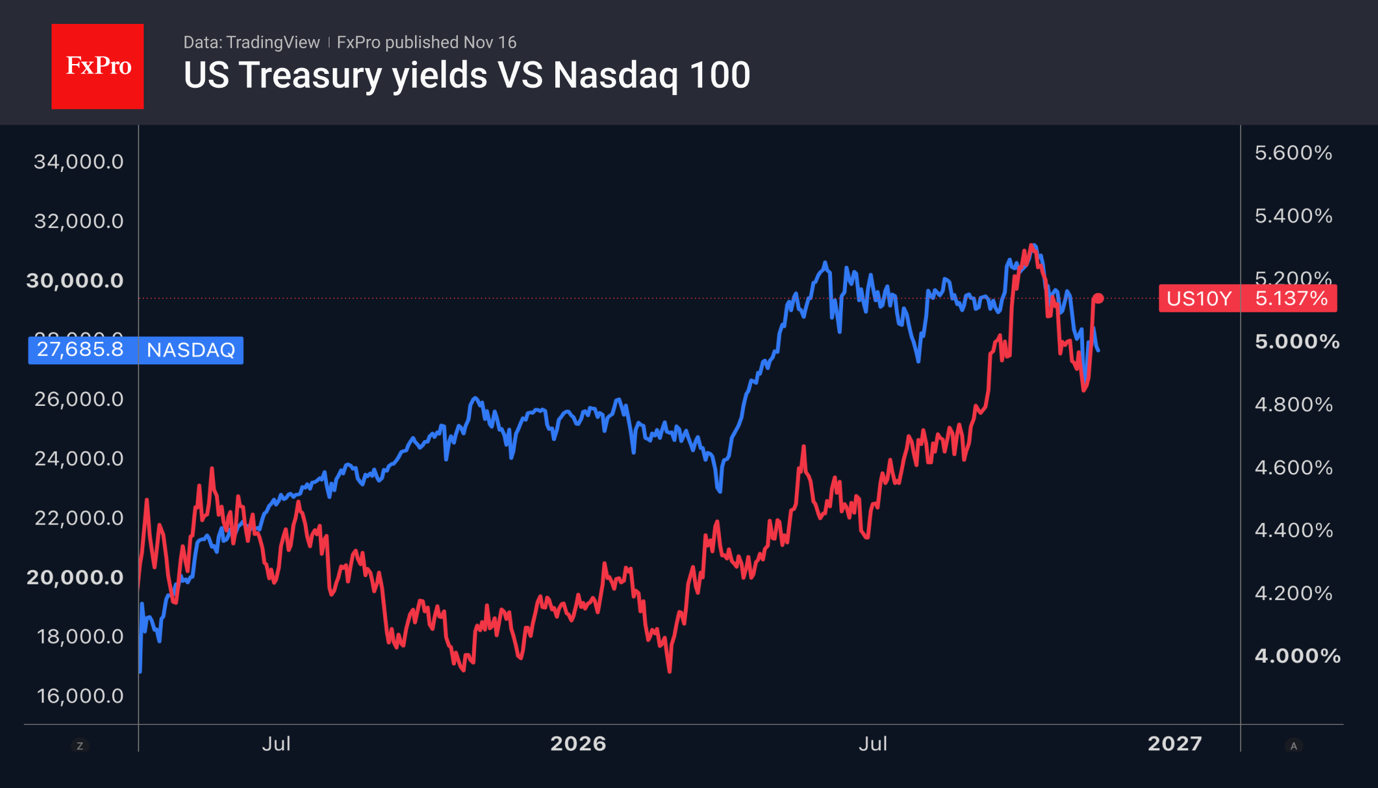
The US dollar posted its best weekly performance since May, driven by several positive factors. The market continued to react to stronger-than-expected US labour market and inflation data, compounded by hawkish rhetoric from FOMC officials. As a result, 10-year Treasury yields returned to levels above 5.10%, paving the way for the USD index to rally to 19-month highs. At the same time, fears about the fate of AI companies have eased somewhat, as signs suggest the fall in NVIDIA’s share price has not triggered a domino effect across the sector, while Reuters reports that applications for Anthropic’s IPO have been oversubscribed many times over.
The fate of the US dollar and the AI industry is inextricably linked. Investment in new technologies and increased consumption driven by the wealth effect, resulting from the rise in the market value of technology company shares, make a huge contribution to GDP growth. The Atlanta Fed’s GDPNow model points to 3.5% growth in the US economy in the fourth quarter.
AI Fears, the Nasdaq-100 and Treasury Yields
Unsurprisingly, the Nasdaq-100’s fall to its lowest levels since April led to a decline in Treasury yields amid increased AI risk-hedging and a weaker dollar. As soon as fears regarding artificial intelligence technologies subsided and inflation data showed an acceleration, EURUSD moved firmly lower.
PPI at 6.5% Strengthens the Case for Fed Hikes
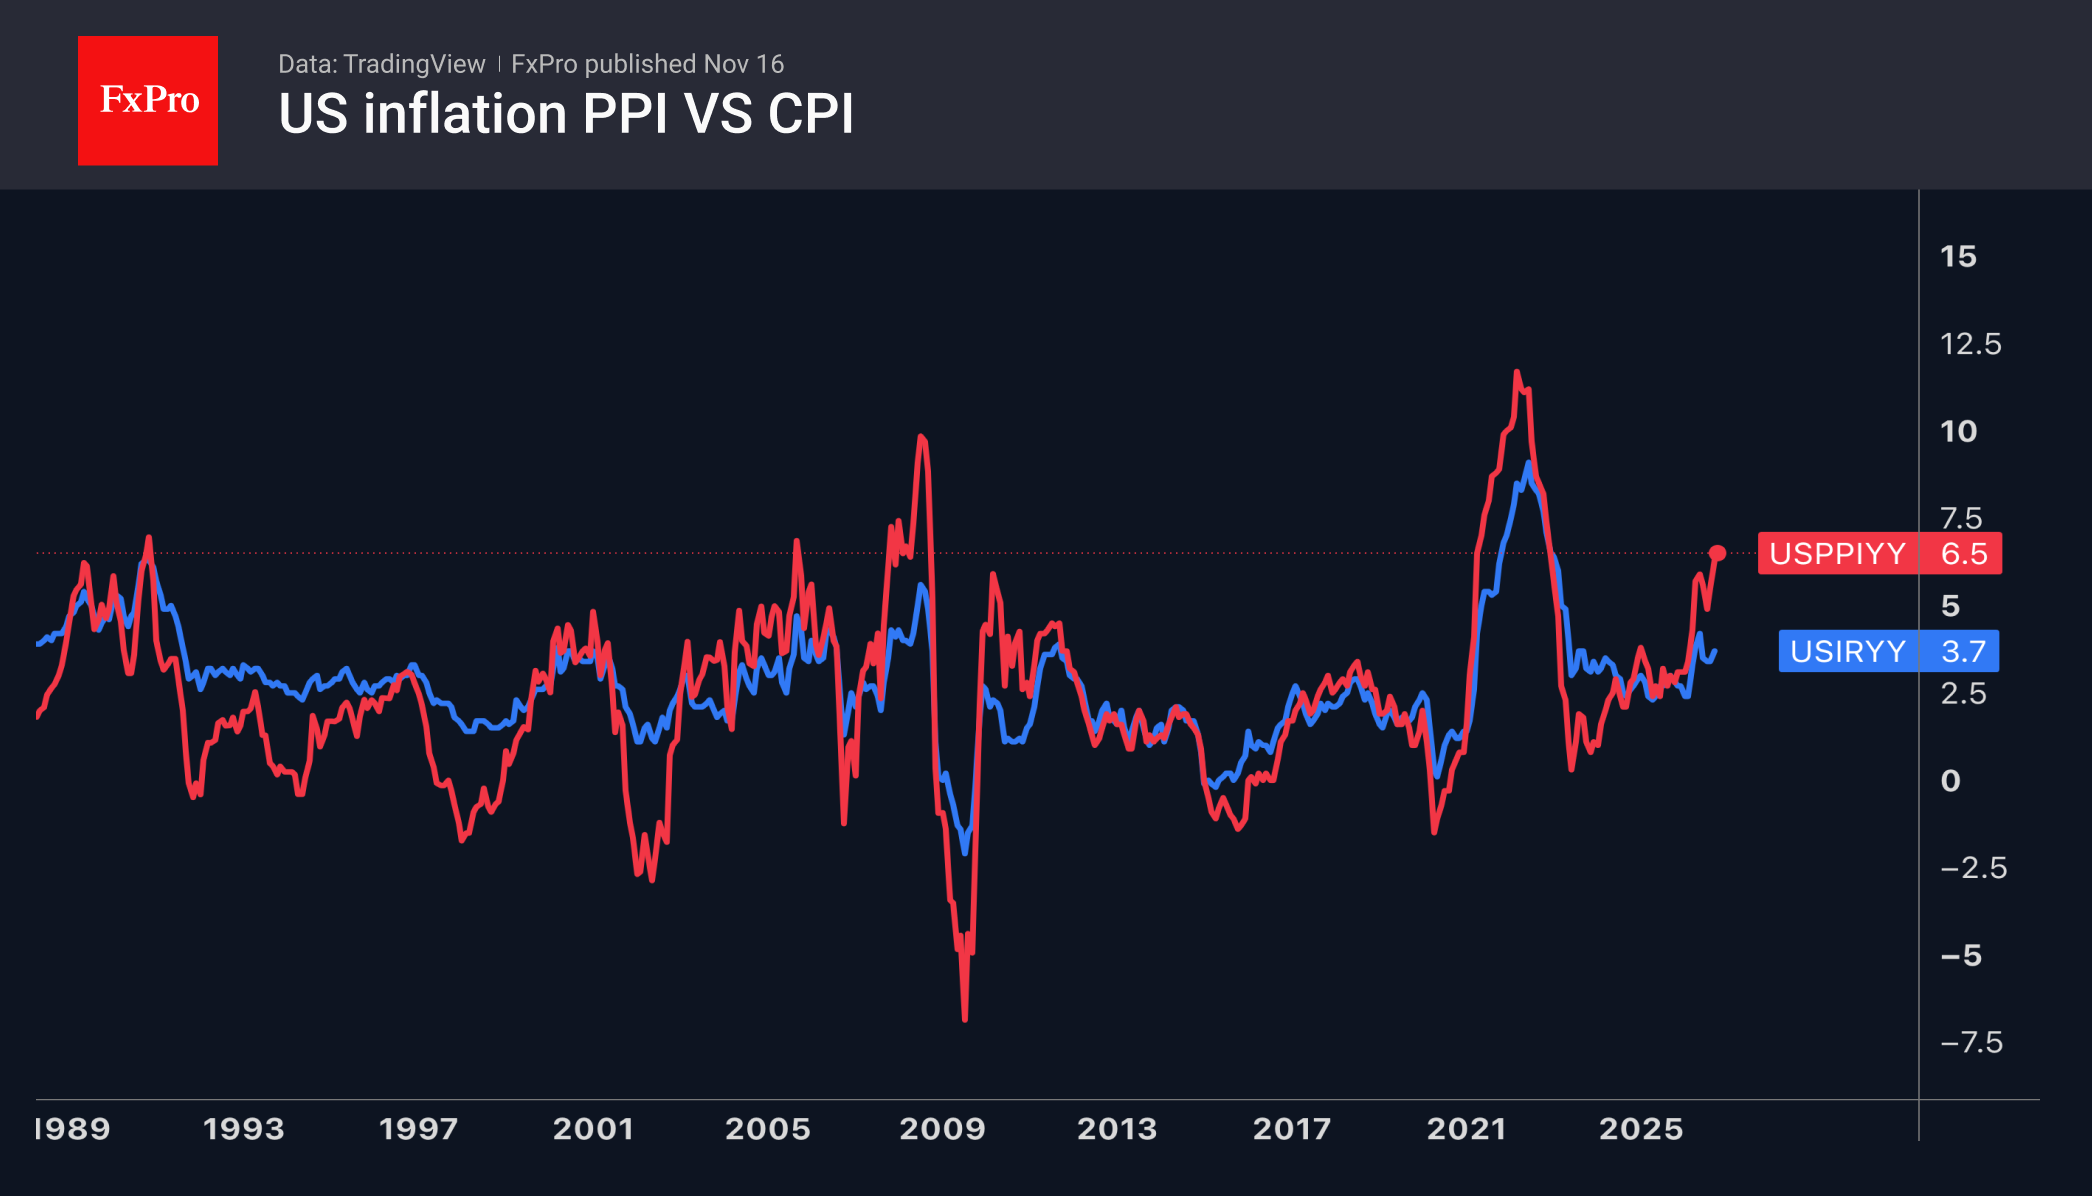
US producer price figures served as the catalyst for the decline in the major currency pair at the end of the week. Year on year, the indicator surged to 6.5%, its highest level since 2022. Against this backdrop, an 80% probability, according to CME FedWatch, of a cumulative 75-basis-point rate hike over the next 12 months seems logical and leaves room for even more decisive tightening, which is what speculators are banking on.
USDJPY Fights for 160 as Banks Disagree on the Yen
Meanwhile, USDJPY is fighting a desperate battle to hold the psychologically important 160 level. The bulls are being supported by the wide spread between the Fed and BoJ interest rates, high global risk appetite and the associated demand for carry trades, and the deterioration in Japan’s terms of trade due to high energy prices. Morgan Stanley forecasts the US dollar will rise to ¥162 by the fourth quarter of 2027.
Goldman Sachs, by contrast, believes that the yen is undervalued by 30% and that next year will see the start of a recovery towards its fair value. As a result, it expects USDJPY to fall to 158, 155 and 150 over 3, 6 and 12 months.
Bitcoin Price Forecast
Every new Bitcoin analysis as it publishes, today's technical signal and key levels, live price — on one page.
See all Bitcoin forecastsJapan’s first GDP decline since July–September 2025, an annualised 0.1% q/q contraction in the third quarter, did not trigger any significant reaction in the yen.
The Crypto Market Has Plummeted to $2.16T, Returning to Its Starting Point
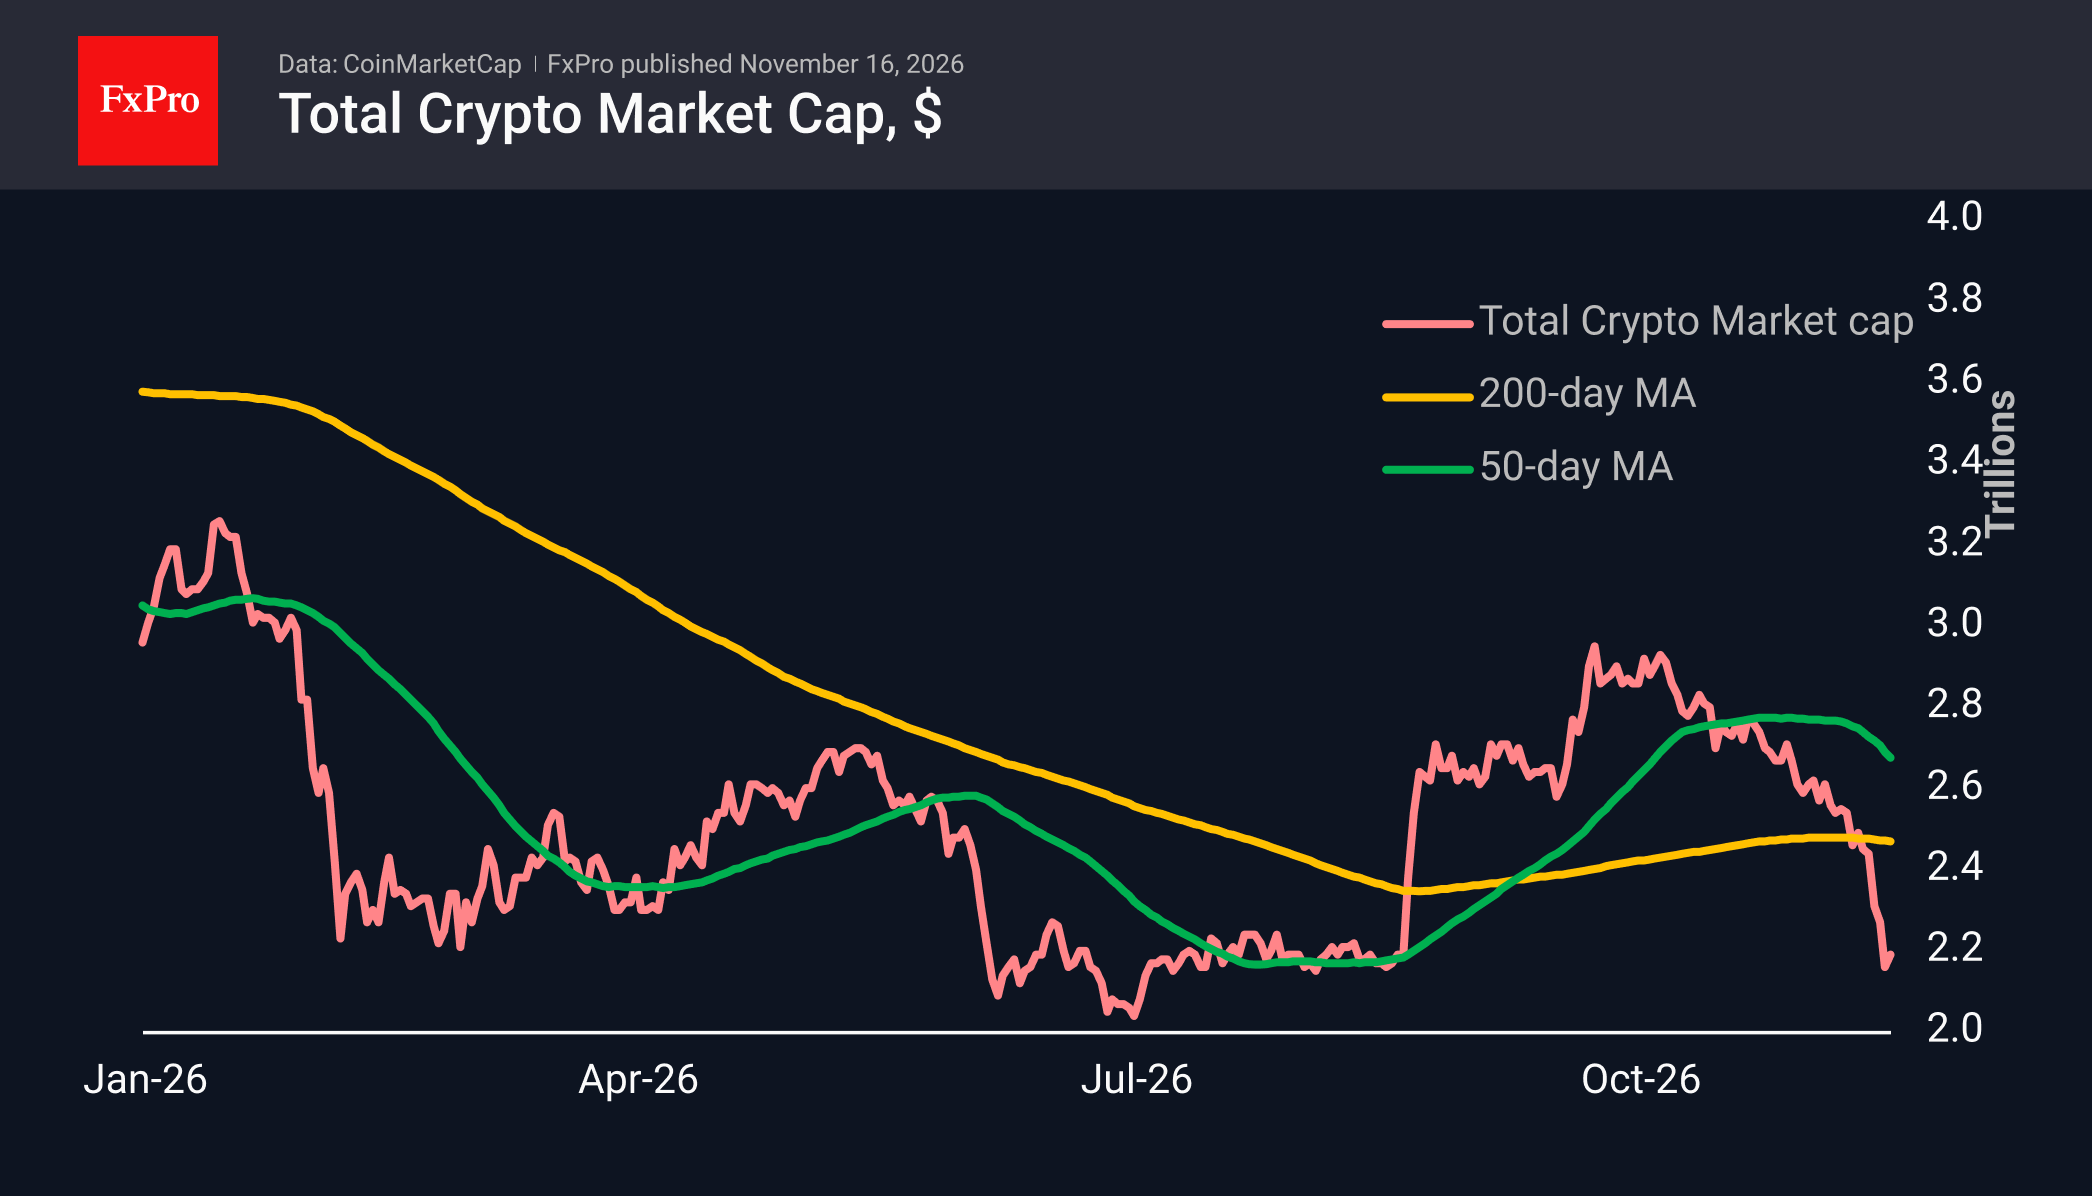
The crypto market capitalisation has plummeted by 11% over the past seven days, falling to $2.19T. At 01:00 GMT on Sunday, the market fell to $2.16T, a level last seen on 17 August, erasing the entire recent rally, which we had regarded as the start of a bull market. Attempts to recover from Sunday’s lows do not yet provide confidence that the market has bottomed out. Among the most liquid coins, gains have predominated over the past 24 hours, as retail investors habitually snap up assets that have fallen in price: the ratio of rising to falling coins is approximately 5:1. The leaders of the rebound were Uniswap (+4.6%), Aave (+4.6%) and VeChain (+3.5%). Filecoin (-2%), Tron (-1.3%) and Immutable (-0.8%) continue to fall.
The Alternative.me Crypto Fear & Greed Index sank to 10 in response to the weekend’s cryptocurrency sell-off. This is the lowest level since 10 June, reflecting deep disappointment with recent developments and signalling extreme fear. Whether this proves to be the low point that rewards bold buyers remains to be seen. Still, more cautious traders will likely prefer to wait for a reliable reversal signal, even at the cost of some potential gains.
Related guide: On-Chain Data: How Smart Crypto Traders Use Blockchain Records to Get an Edge
Bitcoin Holds $64.3–65.3K, but $58K Remains the Downside Risk
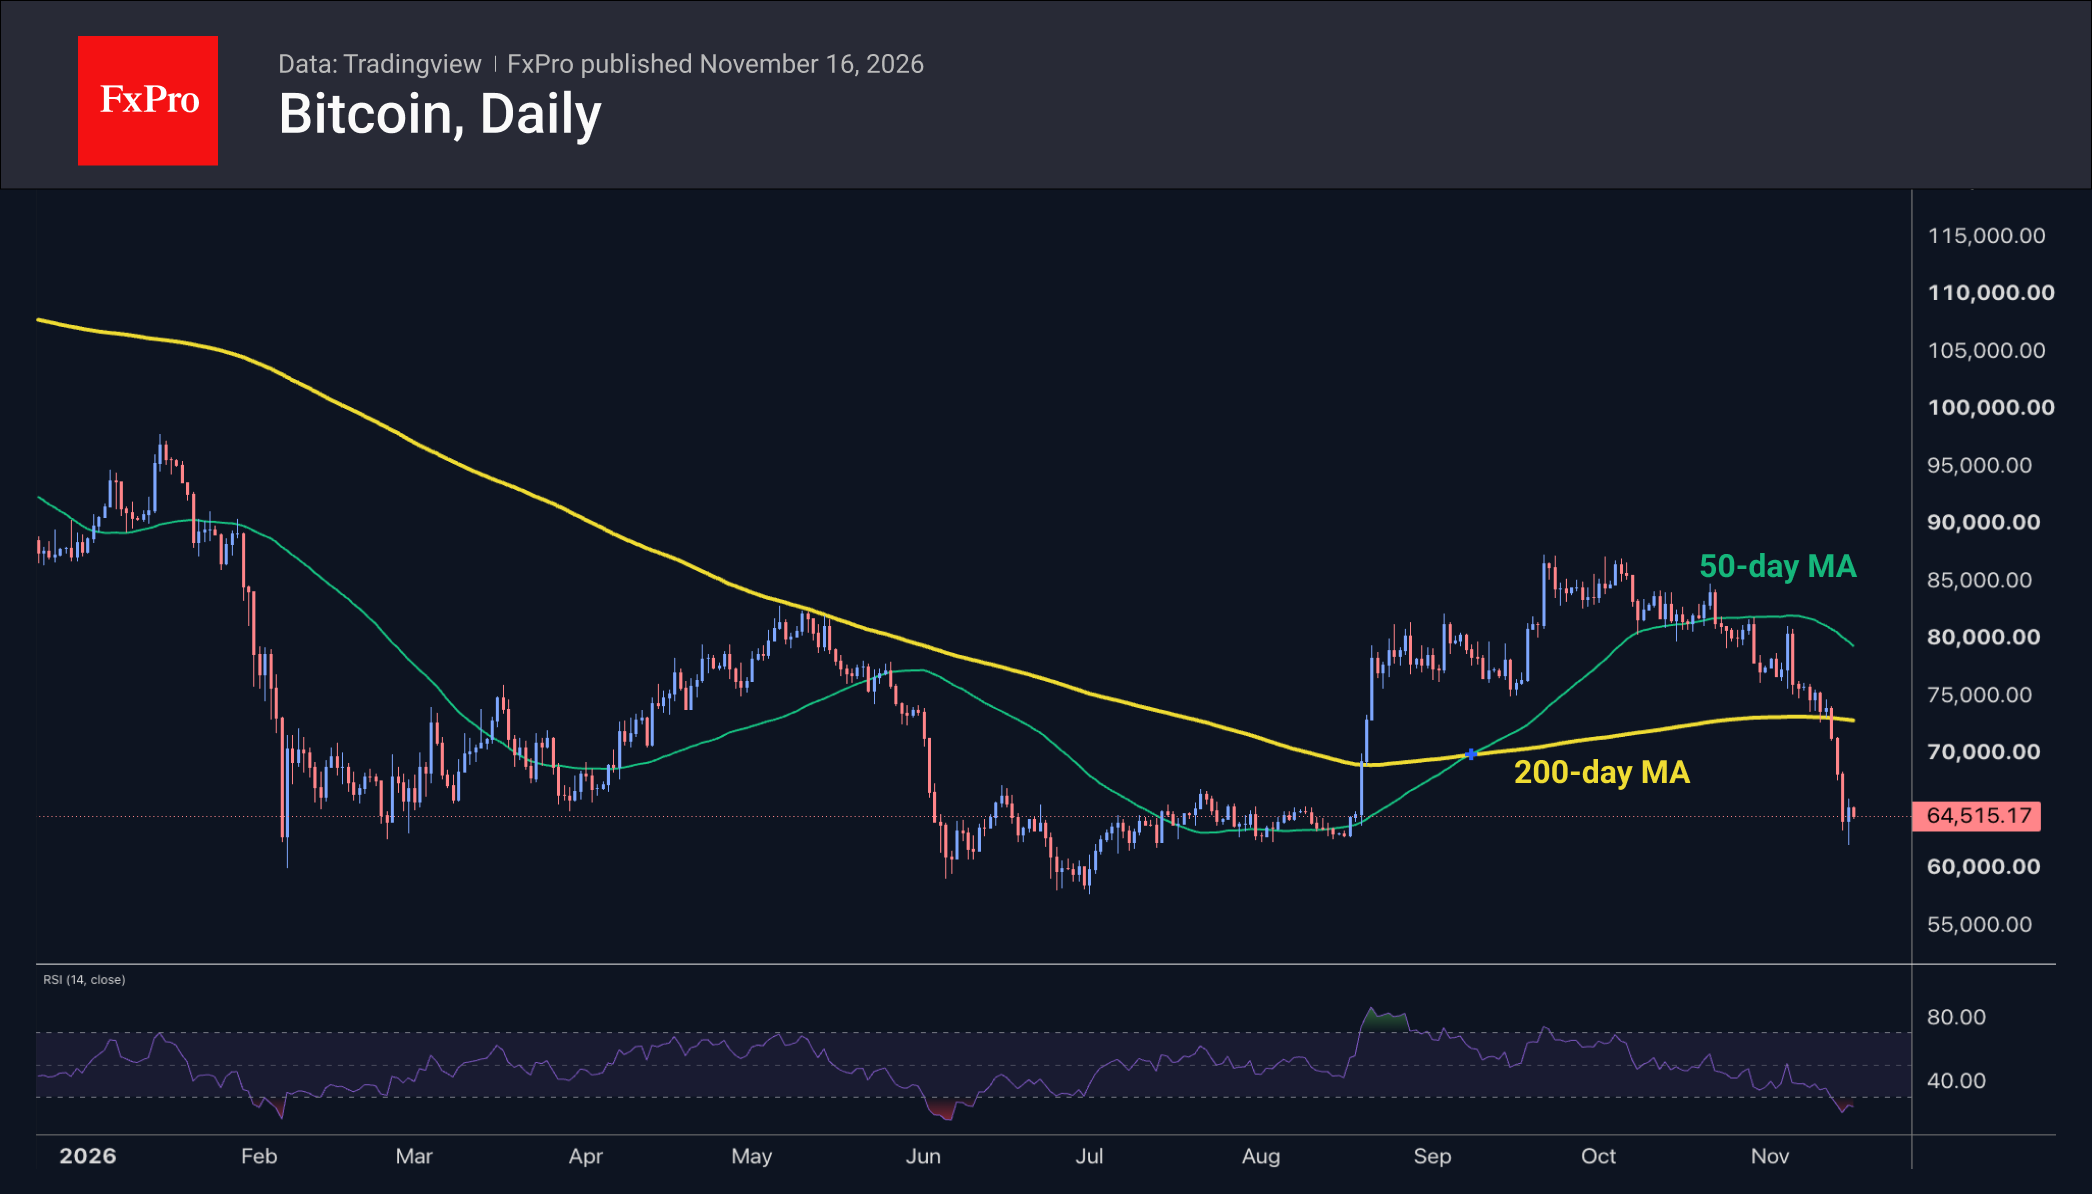
On Sunday, Bitcoin dipped below $62K, then found balance between supply and demand in the $64.3–65.3K range, effectively rebounding from the July–August support zone. Given the strengthening dollar and pressure in the precious metals and equity futures markets early on Monday, it is too early to say that the market has bottomed out. We may now be seeing a pause before a further downward move towards $58K. Nevertheless, we see a slightly higher probability that the impulsive sell-off is nearing exhaustion, to be followed by stabilisation and a reversal to the upside.
Crypto News: ETF Outflows and the Anthropic IPO Effect
SoSoValue notes that significant outflows from US spot Bitcoin ETFs are continuing, totalling $1.07 billion over the week. Outflows over the past two weeks have almost entirely offset all of September’s inflows. Outflows from US spot Ethereum ETFs have now continued for seven consecutive weeks, rising to $398.9 million for the week.
Xapo Bank suggests that Bitcoin’s decline may be linked to a reallocation of capital ahead of Anthropic’s initial public offering. The situation may be similar to SpaceX’s IPO in June 2026.
Bitcoin risks never reaching a new all-time high again, according to analyst ZeeContrarian1. In his view, investors’ funds will flow into more attractive sectors: SpaceX, artificial intelligence and other technologies.
Bitcoin sales on Binance have reached a one-year high, notes analyst Darkfost. In his view, traders’ extreme pessimism could be seen as a bullish signal that often emerges towards the end of a downtrend.
What to Watch
Base case for the dollar: in our view, as long as US inflation keeps accelerating and Treasury yields hold above 5%, the dollar remains supported. Risk: a return of AI fears and a fall in the Nasdaq-100 could push yields lower again and weaken the dollar; for USDJPY, the risk is Japanese intervention above 160.
Base case for crypto: in our view, the odds are slightly in favour of the sell-off running out of steam, followed by stabilisation and a reversal to the upside. Risk: a break below Sunday’s low under $62K would open the way to $58K, with a stronger dollar and ETF outflows adding pressure.
Upcoming: US retail sales on Tuesday, 17 November; the FOMC minutes, UK inflation and a speech by the Bank of England Governor on Wednesday, 18 November; Australian employment data on Thursday, 19 November.
This article is for information only and is not investment advice. Trading CFDs, forex, stocks and cryptocurrencies carries a high risk of losing money; past performance is no guide to future results.