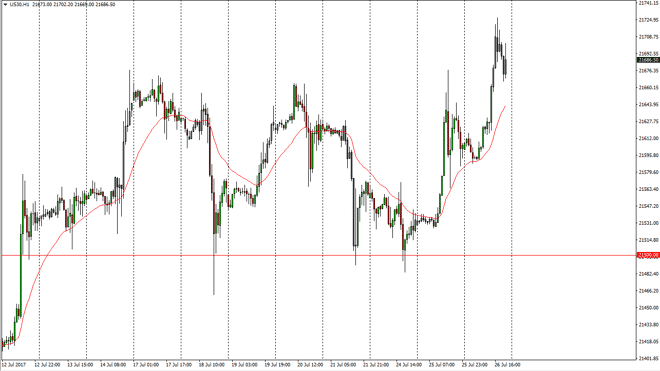
Dow Jones 30 The Dow Jones 30 initially rocketed to the upside during the day on Wednesday, but found enough resistance near the 21,725 level to turn
The Dow Jones 30 initially rocketed to the upside during the day on Wednesday, but found enough resistance near the 21,725 level to turn around. Ultimately, everybody pulled back as they were awaiting the FOMC statement. In the end, the statement ended up being more of the same, and now that we have broken out to a fresh, new high it’s likely that the buyers are going to return on dips. With this being the case, I believe that the stock markets continue to find buyers, but that’s not to say that we won’t have short-term pullbacks in time to time. Given enough time though, I fully anticipate seeing fresh, new highs and therefore have no interest in shorting.
The NASDAQ 100 continued its gentle climb during the session on Wednesday, as we awaited the FOMC statement. After that statement, the market simply sat still and then started to turn up words slowly. I believe that is because the market got everything it wanted, and more importantly: everything is expected. With this being the case, I believe that it’s only a matter of time before we reach towards the vital 6000 handle above, which should be significant resistance based upon psychology. Pullbacks continue to be a buying opportunity, and I think that value hunters will jump into the market to take advantage of these. I think that the 5900-level underneath is massively supportive, and although the 6000 level above will be significantly resistive, it’s probably only a matter of time before the buyers finally break above that level. It will take several attempts, but I think we go higher than that and continue to build on the longer-term uptrend that we have seen in the NASDAQ 100 for so long.
Chris is a proprietary trader with more than 20 years of experience across various markets, including currencies, indices and commodities. As a senior analyst at FXEmpire since the website’s early days, he offers readers advanced market perspectives to navigate today’s financial landscape with confidence.