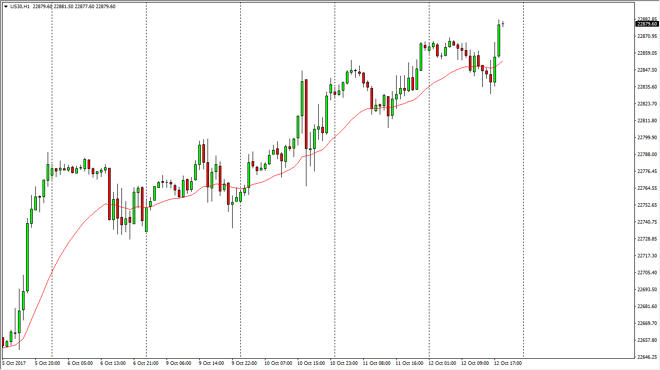
Dow Jones 30 The Dow Jones 30 initially drifted lower at the open on Thursday, but as you can see the 24-hour moving average continues to show signs of
The Dow Jones 30 initially drifted lower at the open on Thursday, but as you can see the 24-hour moving average continues to show signs of support. We have broken out during the day though, and it looks as if we are going to go looking towards the 22,900 level, and then eventually the psychologically significant 23,000 level. I think pullbacks continue to be buying opportunities, as we continue to see a bit of stair stepping on the hourly chart. This is a very strong market that seems hell-bent on reaching towards 23,000. I have no interest in shorting, as industrials are continuing to attract more money in a market that has been very steady and reliable.
The NASDAQ 100 went sideways initially on Thursday, but then rallied significantly to break above the 6080 handle. We now are looking at the 6100 level as a target, and I think we will break out above there given enough time. I think that the 6058 level underneath will continue to be massively supportive. I think pullbacks are buying opportunities as technology seems to be catching up to other sectors of the US stock market right now. The much-exalted death of “FANG” seems to have abated, as the handful of stocks continues to show signs of strength. Ultimately, this is a market that like all of the other US indices that I follow, should continue to find buyers.
Even if we did breakdown below the 6050 handle, the market should go looking towards the 6000 level for even more support. The volatility of course will continue, but being patient and waiting for those pullbacks offer value has worked for months, and I don’t see anything changing anytime soon.
Chris is a proprietary trader with more than 20 years of experience across various markets, including currencies, indices and commodities. As a senior analyst at FXEmpire since the website’s early days, he offers readers advanced market perspectives to navigate today’s financial landscape with confidence.