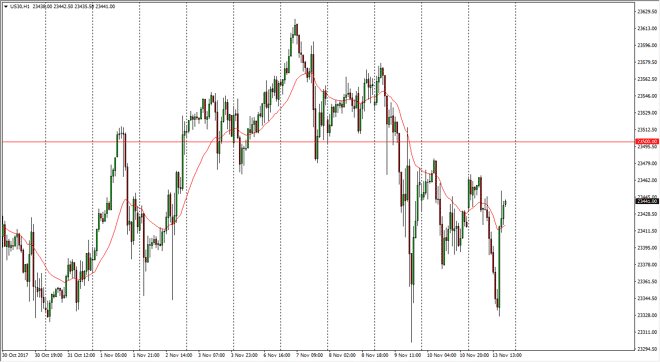
Dow Jones 30 The Dow Jones 30 was very volatile during the trading session on Monday, gapping higher but then rolling over rather drastically. However,
The Dow Jones 30 was very volatile during the trading session on Monday, gapping higher but then rolling over rather drastically. However, once the Americans came back to work we then bounced rather significantly. I think that the market continues to be very noisy, but not until we break above the 23,500 level that I would be comfortable holding onto a position for any length of time. In the meantime, I would anticipate that it is a market that probably goes back and forth, especially with the headlines coming out of Washington DC whether we get some type of tax reform or not. Because of this, this is going to be a very noisy and difficult market to trade, but right now it looks likely to be very choppy and more of a back and forth type of range trade.
The NASDAQ 100 has also been consolidating overall, with the 6280 level on the bottom offering support, and the 6325 level on the top offered resistance. Until we get some type of conclusion to the tax situation in the United States, I don’t know that the NASDAQ 100 can move significantly. As soon as we get some type of certainty, be it good or bad, the market should then move accordingly. In general, I am bullish of this market, but I also recognize that a little bit of a pullback or some good news might help, as we have gotten a bit overextended. In the meantime, expect a lot of short-term scalping in both directions using the previously mentioned levels. The 6300 level is essentially “fair value”, and that’s exactly why we have this consolidation that we are stuck in currently. Be patient, the market looks a bit tired anyway.
Chris is a proprietary trader with more than 20 years of experience across various markets, including currencies, indices and commodities. As a senior analyst at FXEmpire since the website’s early days, he offers readers advanced market perspectives to navigate today’s financial landscape with confidence.