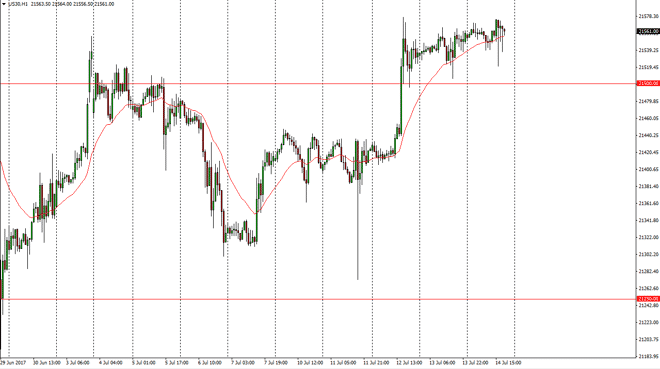
Dow Jones 30 The Dow Jones 30 went sideways initially during the session on Friday, testing the 24-exponential moving average, as the market looks likely
The Dow Jones 30 went sideways initially during the session on Friday, testing the 24-exponential moving average, as the market looks likely to dance sideways overall. Every time we pull back though, there are buyers and we look as if we are bullish in general. I think eventually we could break out towards the 22,000 level, but it is going to take some bullish pressure to get there. I think that every time this market pulls back, it’s likely that there are buyers getting involved. Because of this, I believe that the 21,500 level continues to offer support. Ultimately, this market continues to be volatile, but I think eventually the buyers will run the show. Even if we break down below the 21,500 level, the market should see plenty of support at the 21,450 level. I have no interest in selling.
The NASDAQ 100 went sideways during most of the session, but eventually broke above the 5800 level to spike towards the 5825 level. We pulled back from there to test the 5800 level, and then bounced again. The market looks likely to continue to go to the upside, and therefore I am a buyer of the NASDAQ 100. The massive support underneath should continue to attract buyers, and with this being the case we should then go to the 5850 handle. Longer-term, I expect that the NASDAQ 100 is going to go looking towards the 5900 level as the weekly chart looks extraordinarily bullish. Ultimately, the market should continue to see buyers jump in and take advantage of pullbacks as potential value plays in a market that has lead the way for quite some time. I have no interest in shorting the NASDAQ 100.
Chris is a proprietary trader with more than 20 years of experience across various markets, including currencies, indices and commodities. As a senior analyst at FXEmpire since the website’s early days, he offers readers advanced market perspectives to navigate today’s financial landscape with confidence.