Dow Jones 30 The Dow Jones 30 had a rough session on Friday, dropping down towards the 23,350 level. The market looks likely to see some support in this
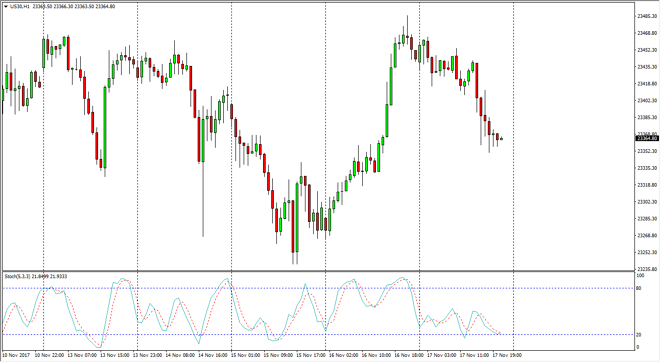
The Dow Jones 30 had a rough session on Friday, dropping down towards the 23,350 level. The market looks likely to see some support in this area, and on the stochastic oscillator, we have dropped enough to reach towards the oversold condition, and perhaps getting ready to cross over. That being the case, I think that buying is probably the best way to go in this general vicinity, but perhaps we may even drop further. The lower we go, the more likely it is going to offer us value that we can take advantage of. I believe that we are in a bit of a “holding pattern”, as we await the U.S. Congress to do its job. Tax bills are difficult but necessary to extend the profitability of US companies.
The NASDAQ 100 drifted a bit lower but has been more resilient than the Dow Jones 30. Because of this, I think we need to see a little bit more bearish pressure, perhaps reaching towards the 6300-level underneath, which is an area that’s been important for both buyers and sellers recently. I believe that the market probably needs to drop down further though, and relatively soon. Quite frankly, even though we formed a hammer on the weekly chart I am a bit leery about buying at these extended levels. The market should react positively to a tax bill, and I think we are essentially waiting for that over here as well. The NASDAQ 100 is especially sensitive to this as repatriation of funds overseas for US tech companies will be paramount as to where we go next. I expect that today could be a bit soft, but I certainly wouldn’t be a seller of a market that is this strong.
Chris is a proprietary trader with more than 20 years of experience across various markets, including currencies, indices and commodities. As a senior analyst at FXEmpire since the website’s early days, he offers readers advanced market perspectives to navigate today’s financial landscape with confidence.