
Advertisement
Advertisement
E-mini Dow Jones Industrial Average (YM) Futures Analysis – November 10, 2015 Forecast
By:
December E-mini Dow Jones Industrial Average futures are trading sideways to lower shortly before the cash market opening. There was no follow-through to
December E-mini Dow Jones Industrial Average futures are trading sideways to lower shortly before the cash market opening. There was no follow-through to the downside after yesterday’s sharp sell-off. This suggests the move was triggered by long-liquidation rather than short-selling.
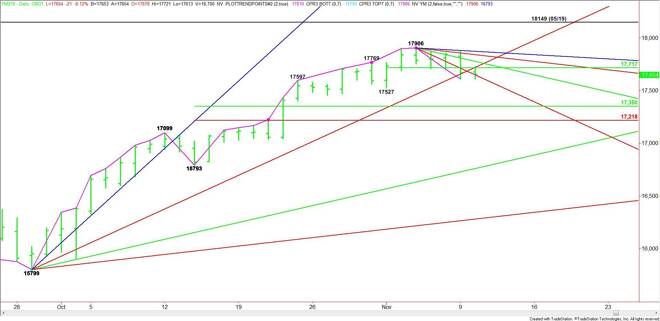
Watch for a retracement of the break from 17906. If this market is headed lower than short-sellers are likely to come in on the retracement. If the market is headed higher then buyers should take out the retracement zone, leading to a move through 17906 and making 17610 a new main bottom.
Despite Monday’s sharp sell-off, the main trend is still up according to the daily swing chart. Taking out 17527, however, will turn the minor trend down.
The short-term range is 17527 to 17906. Its pivot or 50% level is 17717. Trader reaction to this level will likely determine the tone of the market today.
Based on yesterday’s close at 17675, the key Gann angles to watch today are a downtrending angle at 17650 and an uptrending angle at 17719.
A sustained move under 17650 will indicate that the selling pressure in coming in early. This could trigger a quick break into yesterday’s low at 17610. This is followed by the minor bottom at 17527. Taking out this level could trigger the start of a steep sell-off.
The main range is 16793 to 17906. If 17527 is taken out with conviction then its retracement zone at 17350 to 17218 will be the primary downside target and potential value zone.
The key area on the upside is the price cluster formed by the short-term pivot at 17717 and the long-term uptrending angle at 17719.
A sustained move over 17719 will signal the presence of buyers. This could trigger a labored rally into a series of downtrending angles at 17778, 17842 and 17874. The latter is the last potential resistance angle before the 17906 main top.
To keep it simple, watch the price action and read the order flow at 17717 today. Trader reaction to this pivot will tell us whether the bulls or the bears are in control today.
About the Author
James Hyerczykauthor
James Hyerczyk is a U.S. based seasoned technical analyst and educator with over 40 years of experience in market analysis and trading, specializing in chart patterns and price movement. He is the author of two books on technical analysis and has a background in both futures and stock markets.


Advertisement