
Advertisement
Advertisement
E-mini Dow Jones Industrial Average (YM) Futures Analysis – November 5, 2015 Forecast
By:
December E-mini Dow Jones Industrial Average futures formed a potentially bearish slowing price reversal top on Wednesday. The chart pattern will be
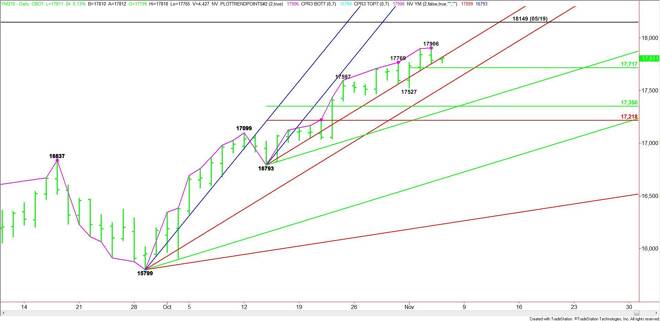
December E-mini Dow Jones Industrial Average futures formed a potentially bearish slowing price reversal top on Wednesday. The chart pattern will be confirmed when yesterday’s low at 17756 is taken out. This move will not indicate the trend has changed to down, but that the selling is greater-than-the buying at current price levels. Any selling pressure will likely be related to profit-taking and position-squaring ahead of Friday’s U.S. Non-Farm Payrolls report.
The main trend is up according to the daily swing chart.
The short-term range 17527 to 17906. Its 50% level or pivot is 17717. This level is controlling the short-term direction of the market.
The main range is 16793 to 17906. Its retracement zone is 17350 to 17218. If sellers start to come in with big volume behind them then the retracement zone will become the primary downside target.
Based on the close at 17787, two levels will determine the direction of the market today.
A sustained move over the steep uptrending angle at 17817 will indicate the presence of buyers. If enough upside momentum is created by this move then look for a test of the reversal top at 17906.
Taking out 17906 will negate the reversal top. This could trigger a breakout to the upside especially if the move is triggered by more than buy stops and short-covering. Aggressive real buyers would likely set their sights on the May 19 top at 18149.
A sustained move under 17817 will signal the presence of sellers. However, don’t expect an acceleration to the downside unless the short-term pivot is taken out with conviction.
If sellers come in after breaking the pivot at 17717 then the break could extend into a potential support cluster at 17527. This is a combination of Monday’s low and a long-term uptrending angle.
Breaking 17527 with increasing volume should eventually lead to a test of the primary objective at 17350 to 17218.
Watch the price action at 17817 and 17717 today. Look for an upside bias to develop on a sustained move over 17817 and a downside bias to develop on a sustained move under 17717.
About the Author
James Hyerczykauthor
James Hyerczyk is a U.S. based seasoned technical analyst and educator with over 40 years of experience in market analysis and trading, specializing in chart patterns and price movement. He is the author of two books on technical analysis and has a background in both futures and stock markets.


Advertisement