
Advertisement
Advertisement
E-mini NASDAQ-100 Index (NQ) Futures Technical Analysis – August 3, 2015 Forecast
By:
September E-mini NASDAQ-100 Index futures finished lower on Friday after giving back most of its earlier gains. The selling occurred inside a retracement
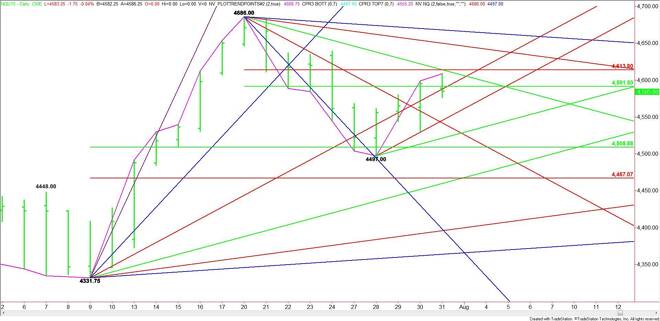
September E-mini NASDAQ-100 Index futures finished lower on Friday after giving back most of its earlier gains. The selling occurred inside a retracement zone which suggests a secondary lower top may be forming.
The main trend is up on the daily chart. The short-term range is 4686.00 to 4497.00. Its retracement zone is 4591.50 to 4613.75. Trader reaction to this zone will set the tone of the market today. This zone rejected the rally on Friday when the market traded 4608.75.
Based on Friday’s close at 4585.00, the direction of the market today is likely to be determined by trader reaction to the 50% level at 4591.50.
A sustained move under 4591.50 will signal the presence of sellers. The daily chart opens up under this level with the next target an uptrending angle at 4561.00. The next angle under this is 4529.00. This is followed by a major 50% level at 4508.75.
Overcoming the 50% level at 4591.50 will signal the presence of buyers. Crossing to the bullish side of the uptrending angle at 4603.75 will signal the buying is getting stronger. Two resistance levels come in at 4606.00 and 4613.75. The Fibonacci level at 4613.75 is a potential trigger point for an upside breakout into the resistance angles at 4646.00 and 4666.00. The latter is the last angle before the 4686.00 main top.
Watch the price action and read the order flow at 4591.50 today. This will tell us whether the bulls or the bears are in control.
About the Author
James Hyerczykauthor
James Hyerczyk is a U.S. based seasoned technical analyst and educator with over 40 years of experience in market analysis and trading, specializing in chart patterns and price movement. He is the author of two books on technical analysis and has a background in both futures and stock markets.


Advertisement