
Advertisement
Advertisement
E-mini NASDAQ-100 Index (NQ) Futures Technical Analysis – November 11, 2015 Forecast
By:
December E-mini NASDAQ-100 Index futures are called better shortly before the regular session opening. Today is a U.S. bank holiday so tread lightly
December E-mini NASDAQ-100 Index futures are called better shortly before the regular session opening. Today is a U.S. bank holiday so tread lightly because volume may be down. Moves could be exaggerated. The key is to take trades when you have rising volume on your side. Thinly traded markets often set bear and bull traps.
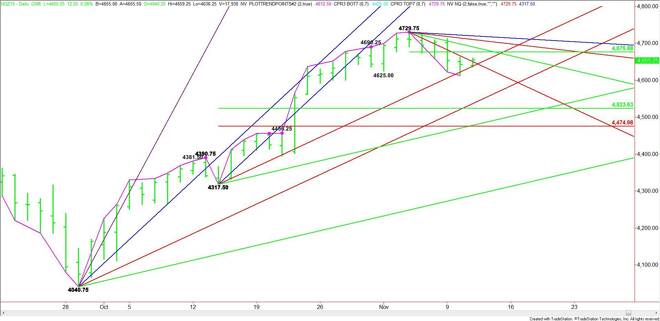
The short-term range is 4729.75 to 4612.50. Its retracement zone is 4671.25. Trader reaction to this level will likely determine the direction of the market today.
Based on yesterday’s close at 4643.00, traders should pay close attention to an uptrending angle at 4637.50 and a downtrending angle at 4649.75 early in the session.
Holding 4637.50 will be the first sign of buying. Taking out the angle at 4649.75 will signal that the buying is getting stronger. This could lead to a test of the pivot at 4671.25.
Crossing to the strong side of the pivot at 4671.25 could trigger a breakout to the upside, but the rally is likely to be labored because of a series of downtrending angles at 4689.75, 4709.25 and 4719.75. The latter is the last potential resistance angle before the 4729.75 main top.
A sustained move under 4637.50 will indicate the presence of sellers. The first objective is a minor low at 4612.50. The daily chart opens up to the downside under this level with the next major target a long-term uptrending angle at 4536.75.
If the selling pressure continues over the near-term then the primary downside target will be the retracement zone at 4523.50 to 4475.00.
Watch the price action and order flow at 4637.50 and 4649.75 early in the session. If there is an upside breakout then the next key level is 4671.25. A failure at 4637.50 with selling volume behind it could trigger a steep decline.
About the Author
James Hyerczykauthor
James Hyerczyk is a U.S. based seasoned technical analyst and educator with over 40 years of experience in market analysis and trading, specializing in chart patterns and price movement. He is the author of two books on technical analysis and has a background in both futures and stock markets.


Advertisement