
Advertisement
Advertisement
E-mini S&P 500 Index (ES) Futures Technical Analysis – August 21, 2015 Forecast
By:
September E-mini S&P 500 Index futures are trading flat in the pre-market session after following through to the downside following yesterday’s steep
September E-mini S&P 500 Index futures are trading flat in the pre-market session after following through to the downside following yesterday’s steep sell-off.
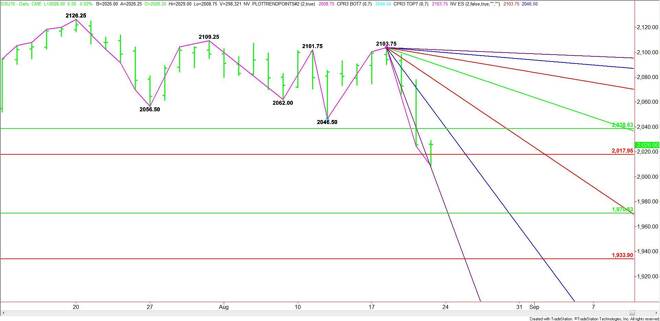
The main trend is down according to the daily swing chart. This was reaffirmed on Thursday when the index traded through the previous main bottom at 2046.50.
The contract range is 1815.00 to 2126.25. Its retracement zone is 2038.75 to 2018.00. During the pre-market session, the index traded as low as 2008.75 before bouncing back to 2028.00.
The steep downtrending angle that was successfully tested came in at 2007.75. Crossing over to the weak side of this angle later in the session will put the index in an extremely bearish position.
Crossing to the weak side and overcoming the major Fibonacci level at 2018.00 indicates that the break to 2008.75 may have been triggered by sell stops or overly aggressive short sellers. This level is new support.
If the upside momentum continues during the regular session, the next upside objective becomes the major 50% level at 2038.75. This is followed by a steep downtrending angle at 2055.75.
Based on the early price action, the key number to watch is the Fibonacci level at 2018.00. Holding above this level will give the index a slight upside bias. Crossing to the weak side of this level will indicate the presence of sellers. A sustained move to the weak side of the steep angle at 2007.75 will put the index in an extremely bearish position.The retracement zone of the contract range is 1970.50 to 1934.00. A sustained move under 2007.75 could trigger a move into this zone over the near-term.
Watch the price action and read the order flow at 2018.00. This will tell us whether the bulls or the bears are in control. Holding this level could drive the market into 2038.75. A failure at this level targets 2007.75.
About the Author
James Hyerczykauthor
James Hyerczyk is a U.S. based seasoned technical analyst and educator with over 40 years of experience in market analysis and trading, specializing in chart patterns and price movement. He is the author of two books on technical analysis and has a background in both futures and stock markets.


Advertisement