



Gold (XAU) prices gained nearly 1.72% on Monday as the US dollar index dropped nearly 0.59%. The strong correction in oil prices eased inflation concerns and triggered the correction in US dollar index. This pushed gold prices toward the key resistance of $4,150. The market is pricing in 82% chance of a Fed rate hike in December before the release of the US inflation data.
If the inflation data is hotter than expected, it could lift the US dollar index from support and trigger correction in gold prices. On the other hand, if the data is soft, it could extend the correction in the US dollar index and support gold to break above the key level of $4,150.
A Break Above $4,150 Could Extend Gold’s Recovery
The 4-hour chart for spot gold shows that the price traded within the descending channel pattern from the highs of September 2026. The price broke above the channel on 4 November 2026 and hit the key resistance near $4,150.
The move from the lows of 30 October 2026 at $3,870 towards $4,150 is V-shaped recovery. This V-shaped recovery suggests positive price action in the short term. If gold price holds the support of $4,000 and breaks above $4,150, it could open the way for further upside towards $4,250 and then $4,400.
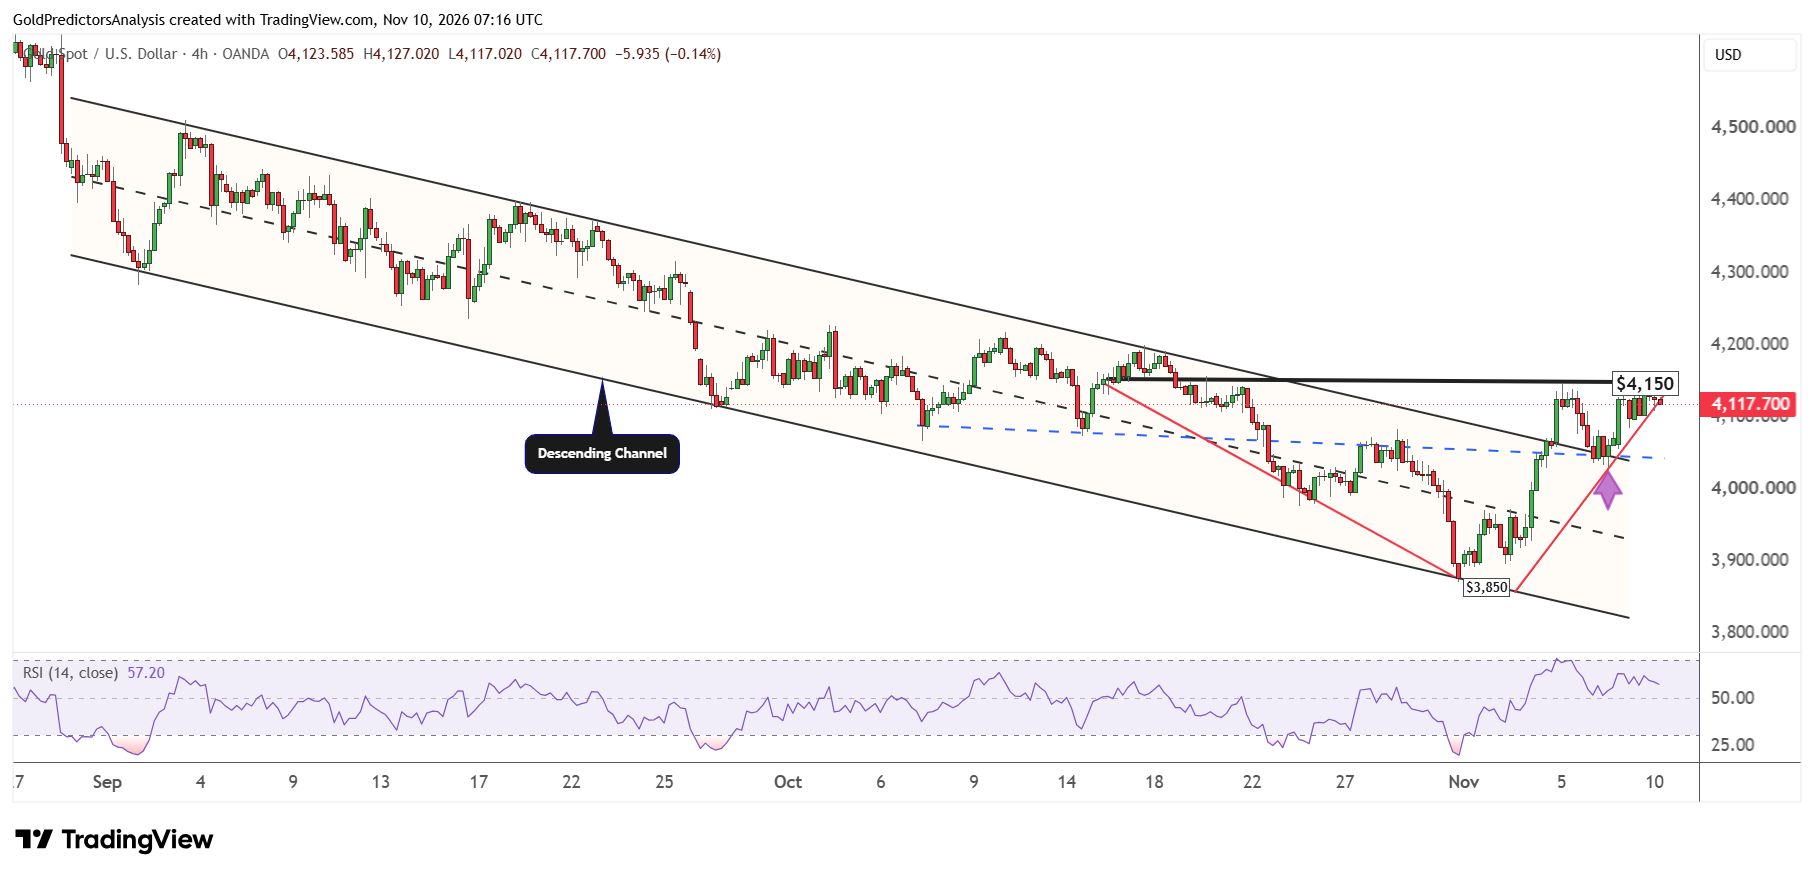
The RSI also rebounded from oversold levels when the gold price recovered from $3,870. The RSI is now consolidating above the midline ahead of the US inflation report. But the hotter than expected inflation data may trigger a correction in gold prices. A break below $4,000 may open the way for further downside towards $3,870.
Gold Price Forecast
Every new Gold analysis as it publishes, today's technical signal and key levels, live price — on one page.
See all Gold forecastsCan Gold Regain Ground Against the Nasdaq 100?
Nasdaq 100 Outpaces Gold on Monday
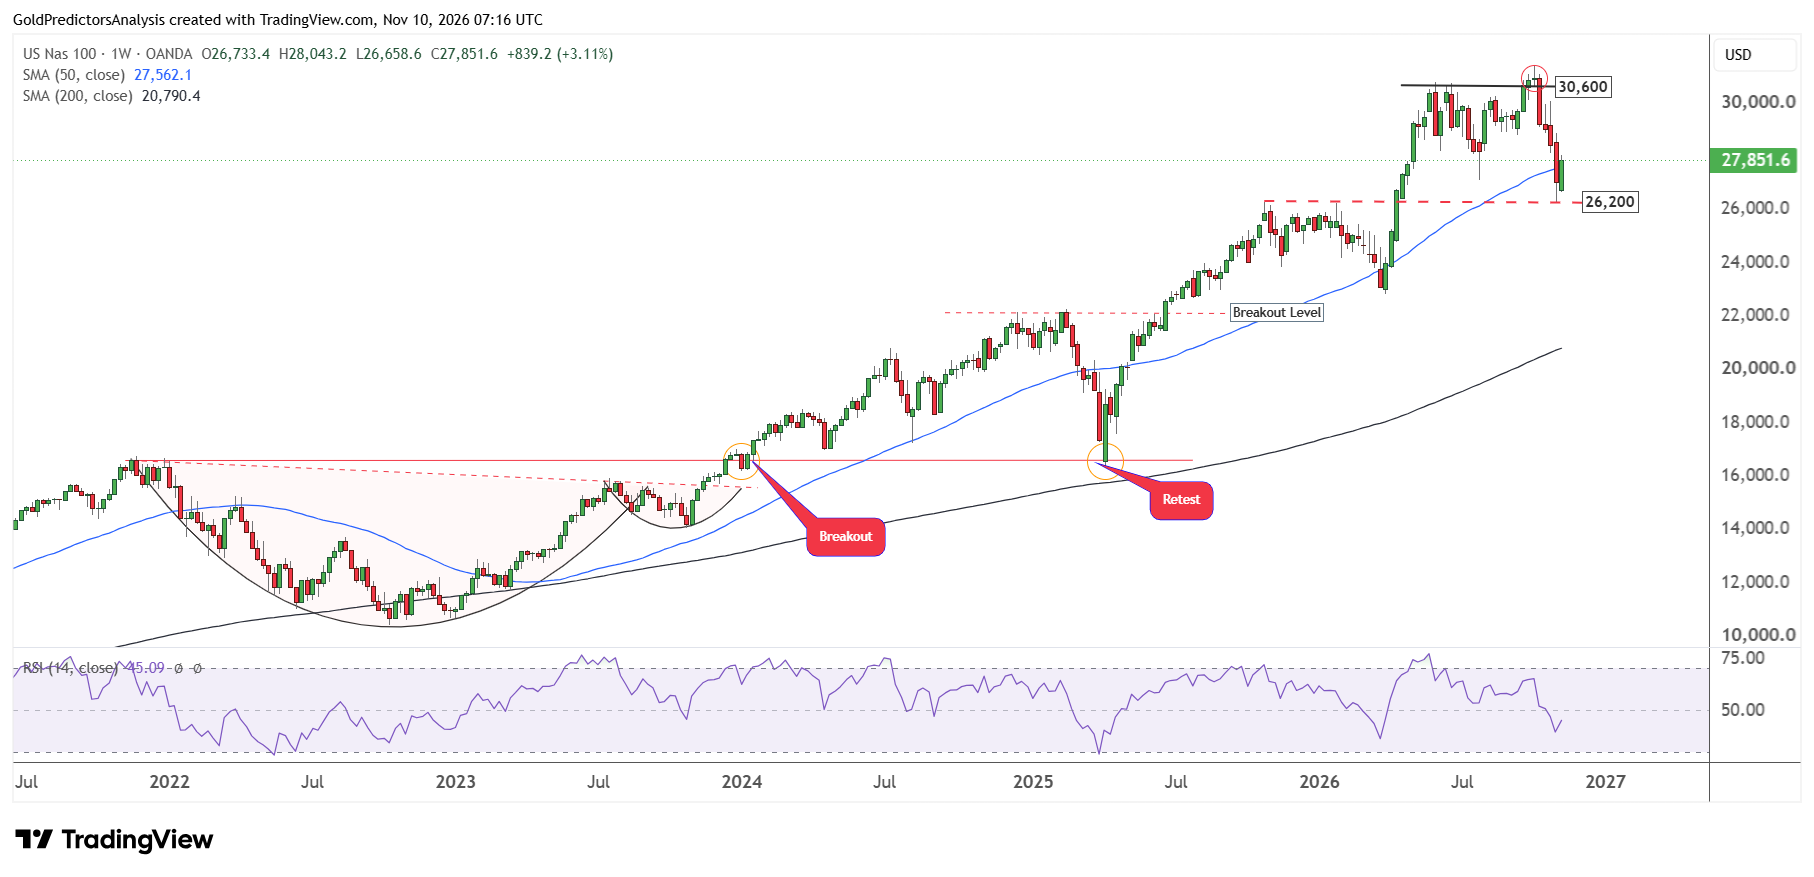
The Nasdaq 100 rebounded from key support near 26,200 and gained over 3.5% on Monday to close near the 27,986 level. This strong rebound from 26,200 suggests that the index could extend the rally this week.
The formation of cup and handle patterns from November 2021 to November 2023 suggests positive outlook. Then the positive price action from 2024 towards the record high in 2026 suggests that the overall trend for the Nasdaq 100 remains bullish in the long term. Gold prices also gained on Monday but by less than the index.
Gold-to-Nasdaq 100 Ratio Forms a Long-Term Triangle
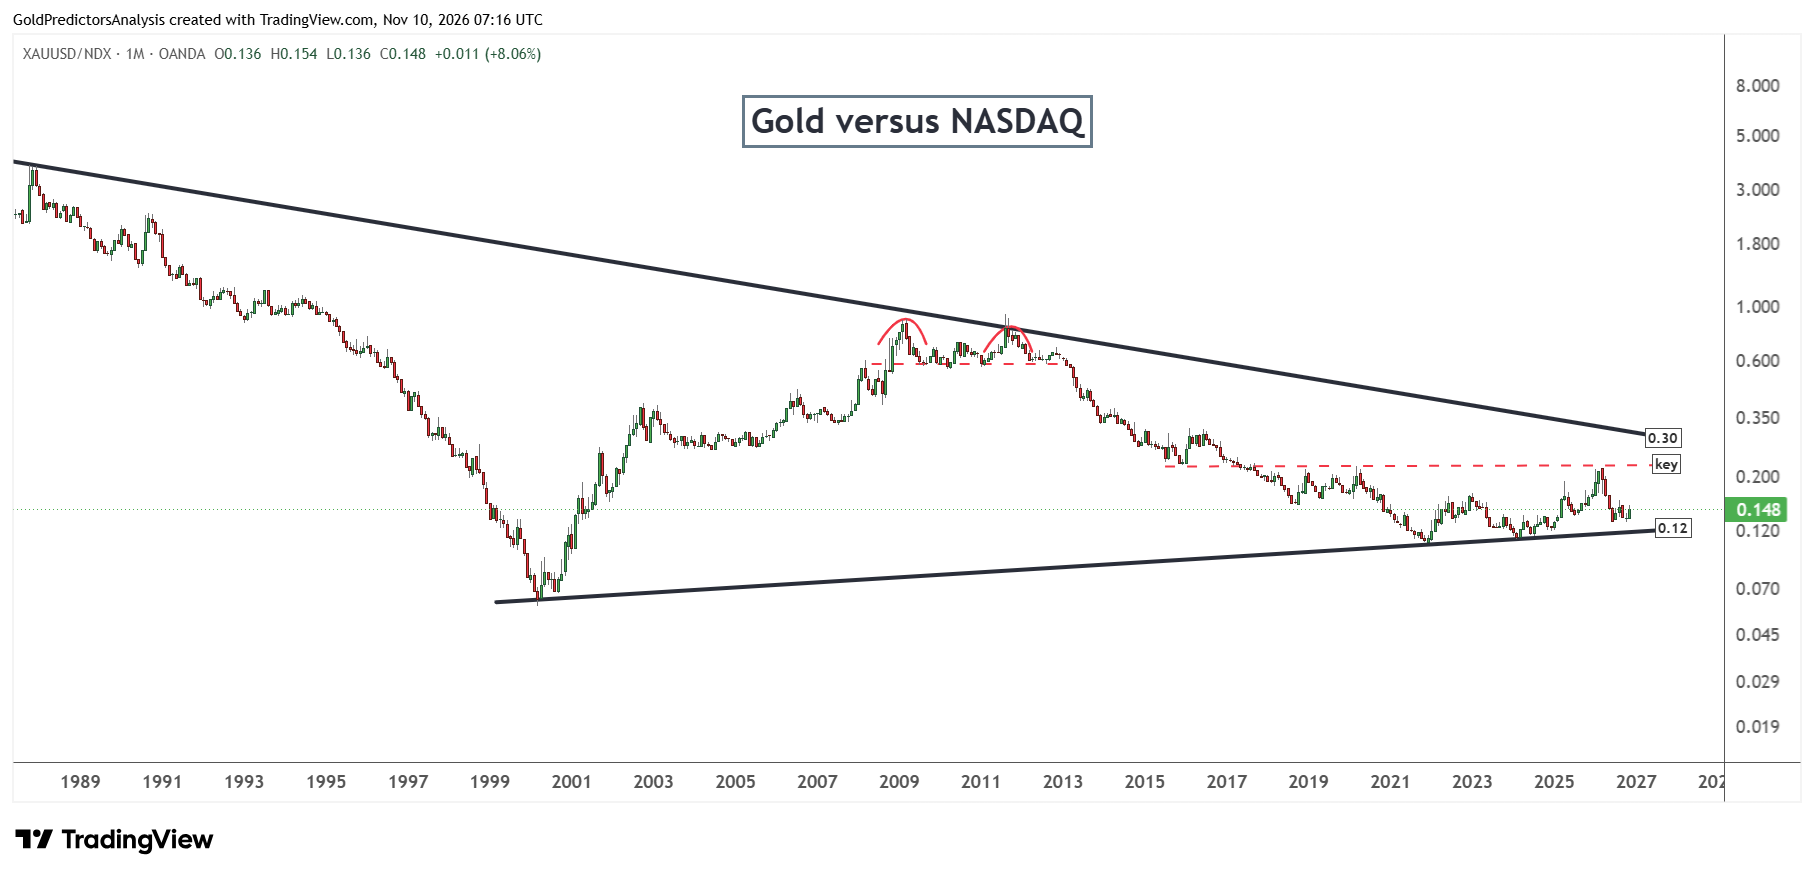
The monthly chart for the ratio of gold to Nasdaq 100 shows that the ratio has traded within the triangle pattern since the highs of 1987. The ratio formed lows in December 2021 and April 2024, which triggered a strong rally in the ratio. Gold prices surged during that rally. The ratio dropped again after gold reached the high of $5,600 in January 2026.
The consolidation in the ratio over the past five months suggests that momentum is building. This momentum may push ratio back towards the key level of 0.22. This suggests that gold could outperform Nasdaq 100 during the next phase of growth. This suggests that gold may be forming a bottom near support. A confirmed break above 0.30 in the ratio could signal strong rally in gold prices in the long term.
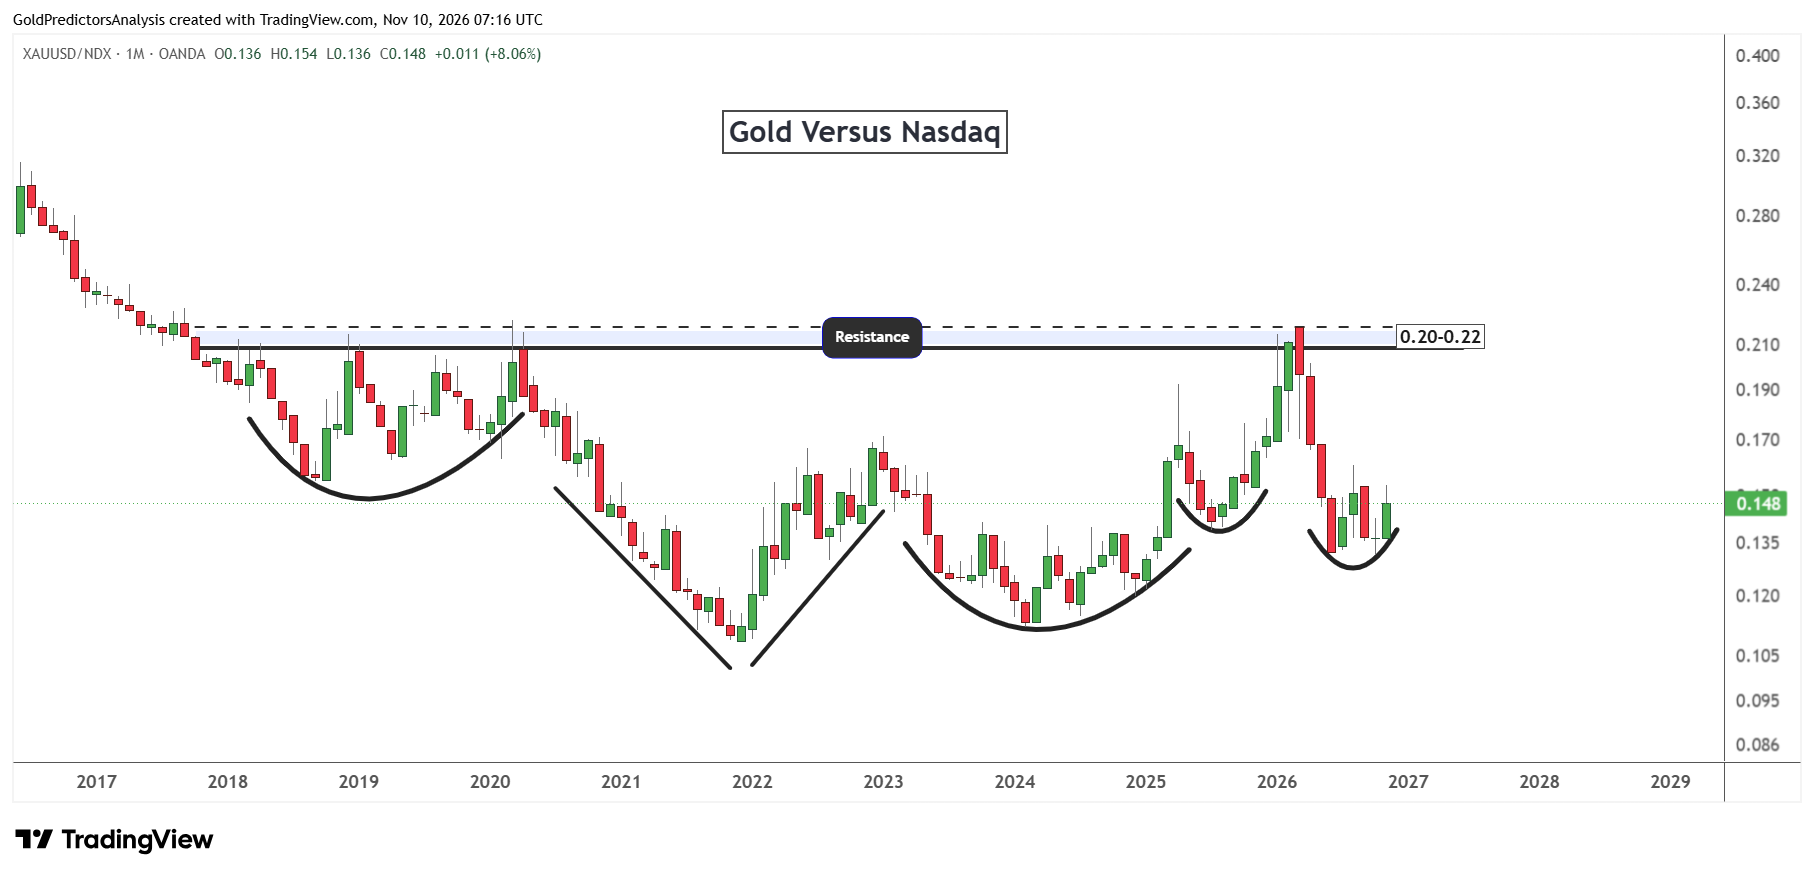
The chart below shows that the ratio formed bullish price action over the past 10 years. This constructive outlook is seen in the V-shaped recovery in 2022 and rounding bottom formation in 2024 and 2025.
The five months of consolidation suggest that the ratio has formed a bottom in the short term. A break above 0.16 would likely open the way for further upside towards the range of 0.20-0.22 and may suggest a rally in gold prices.
What to Watch Next?
The key resistance for the gold price is $4,150 in the short term. The price is consolidating below this level ahead of the US inflation data. The softer inflation data may initiate a correction in US dollar and trigger a strong rally in gold to break above the $4,150 level. A break above $4,150 may suggest a move to $4,250. On the other hand, hot inflation data may lift the US dollar and push the gold price below $4,000.
The ratio of gold to Nasdaq 100 faces key resistance at 0.16. A break above this level may trigger a stronger rally in gold prices as gold will likely outperform the technology stocks. Therefore, the breakout above 0.16 in the ratio will likely strengthen the possibility of a bottom in the gold market.