



Gold futures are testing a two-month low on Monday, continuing the previous session’s sell-off that was fueled by stronger-than-expected U.S. inflation and consumer spending data. The reports stoked fears that the Federal Reserve would deliver more interest rate hikes for a longer period of time than previously anticipated to tame inflation.
At 06:44 GMT, April Comex gold futures are trading $1814.70, down $2.40 or -0.13%. On Friday, the SPDR Gold Shares ETF (GLD) settled at $168.37, down $1.20 or -0.71%.
Data on Friday showed U.S. consumer spending shot up 1.8% last month, the largest increase since March 2021, while the personal consumption expenditures price index, the Fed’s preferred inflation measure, rose 0.6% after gaining 0.2% in December.
Cleveland Fed President Loretta Mester also contributed to the weakness when she said, “It’s going to take more effort on the part of the Fed to get inflation on that sustainable downward path to 2%.”
Currently, money markets expect the Fed’s target rate to peak at 5.408% in September from a current range of 4.50% to 4.75%. This is up from 4.88% on Jan. 31 and the primary reason for gold’s current sell-off.
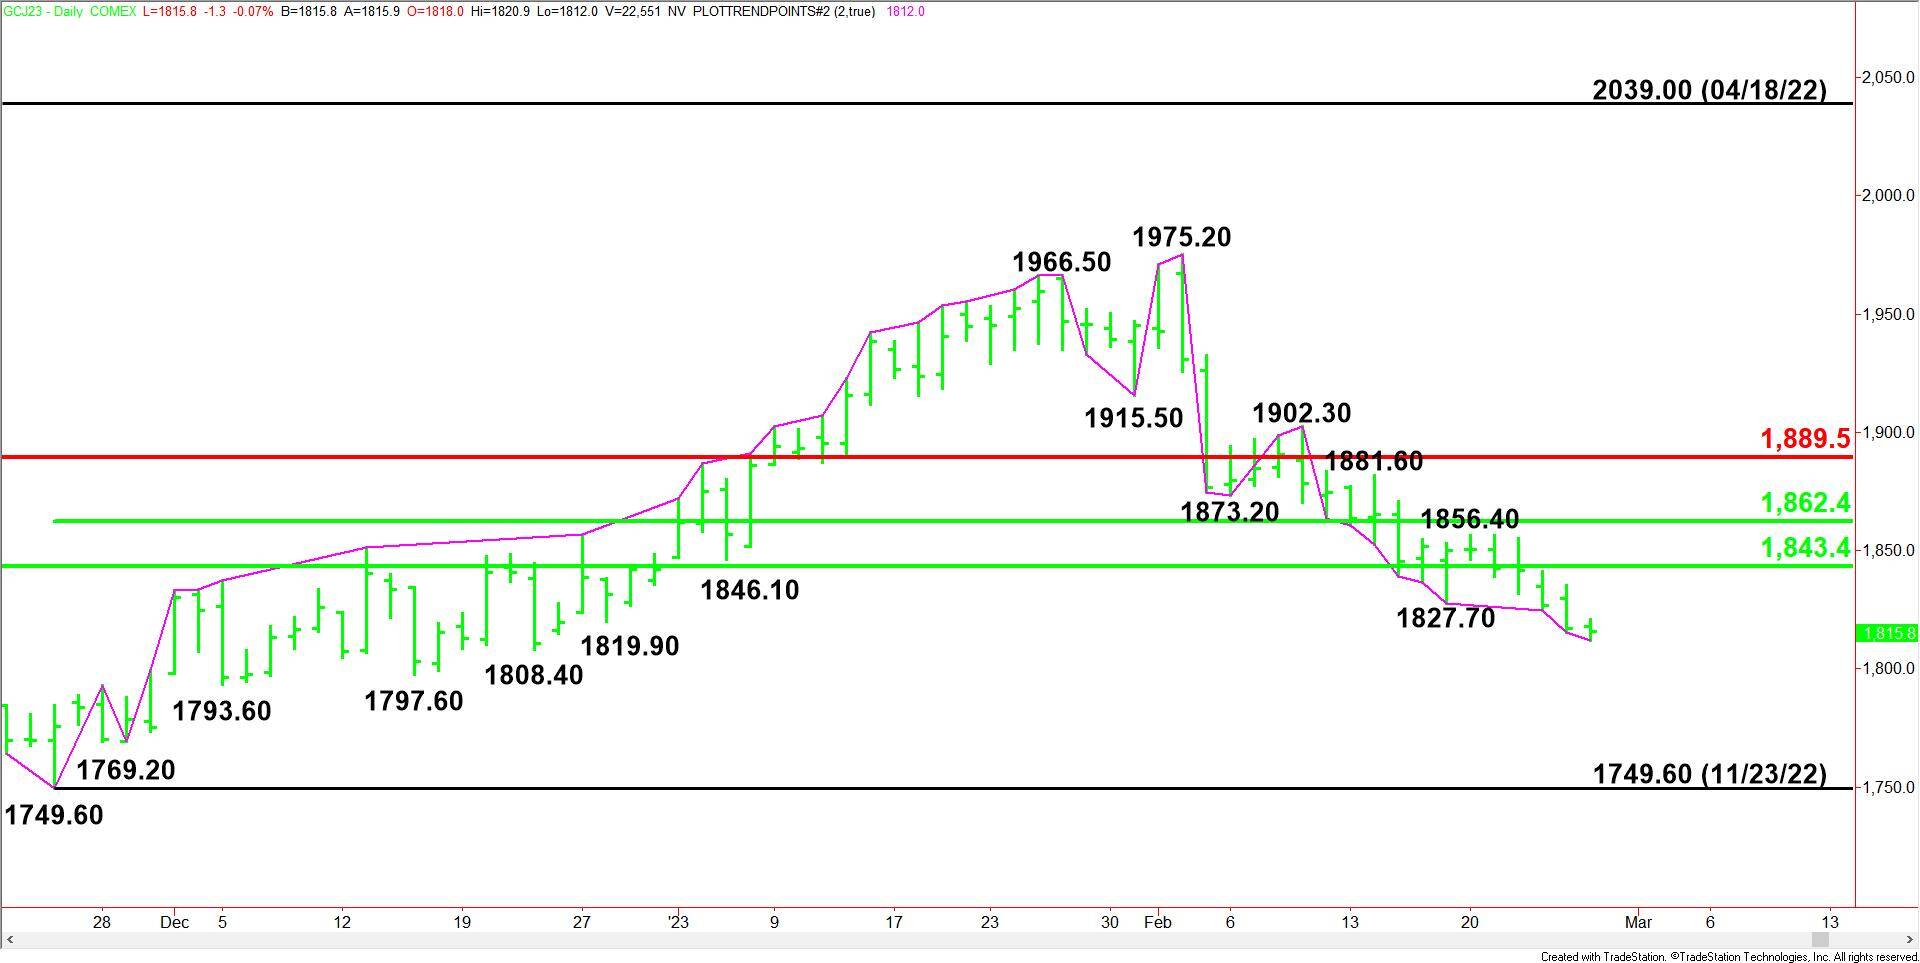
Daily April Comex Gold Technical Analysis
The main trend is down according to the daily swing chart. A trade through the intraday low at $1812.00 will signal a resumption of the sell-off. A move through $1902.30 will change the main trend to up.
The minor trend is also down. A trade through the next minor bottom at $1808.40 will reaffirm the downtrend. A move through $1856.40 will change the minor trend to up. This will shift momentum to the upside.
The nearest resistance is a long-term 50% level at $1843.40.
Daily April Comex Gold Technical Forecast
Trader reaction to $1817.10 will determine the direction of the April Comex gold futures contract on Monday.
Bearish Scenario
A sustained move under $1817.10 will indicate the presence of sellers. If this continues to generate enough downside momentum then look for either a gradual break toward $1749.60, or an acceleration to the downside. The gradual scenario is being fueled by a number of minor bottoms between $1819.90 and $1749.60.
Bullish Scenario
A sustained move over $1817.10 will signal the presence of buyers. If this generates enough upside momentum then look for a surge into the 50% level at $1843.40.
Side Notes
A close over $1817.10 will form a closing price reversal bottom. If confirmed by a follow-through rally, we could see the start of a 2 to 3 day counter-trend rally with potential upside targets coming in at $1843.40 and $1862.40.