XAUUSD failed to break above the descending trend line from 1357.45 to 1334.29 on its 4-hour chart and extended its downside movement to as low as
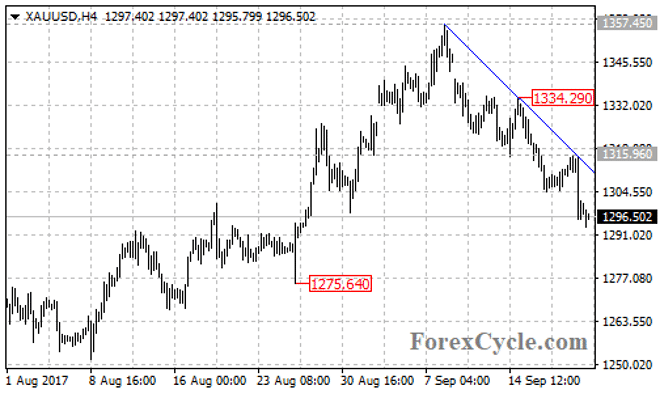
XAUUSD failed to break above the descending trend line from 1357.45 to 1334.29 on its 4-hour chart and extended its downside movement to as low as 1293.25.
On the daily chart, the XAUUSD pair moved below a major support trend line from 1204.77 to 1275.64, indicating that the upside movement from 1204.77 had completed at 1357.45 already.
However, a clear break above the falling trend line on the 4-hour chart could bring price back to test 1315.96 resistance. Above this level will indicate that the short term downtrend from 1357.45 is complete, then the following correction rebound could take price to next resistance level at 1334.29, only break above this level could trigger another rise towards 1400 important psychological level.
Support levels: 1275.64 (the key support), 1251.44 (the August 8 low), 1204.77 (the July 10 low), 1177 (the support trend line on the weekly chart).
Resistance levels: 1312 (the falling trend line on the 4-hour chart), 1315.96 (near term resistance), 1334.29, 1357.45 (the September 8 high), 1375.11 (the July 2016 high), 1400 (the important psychological level).