


Gold Technical Analysis
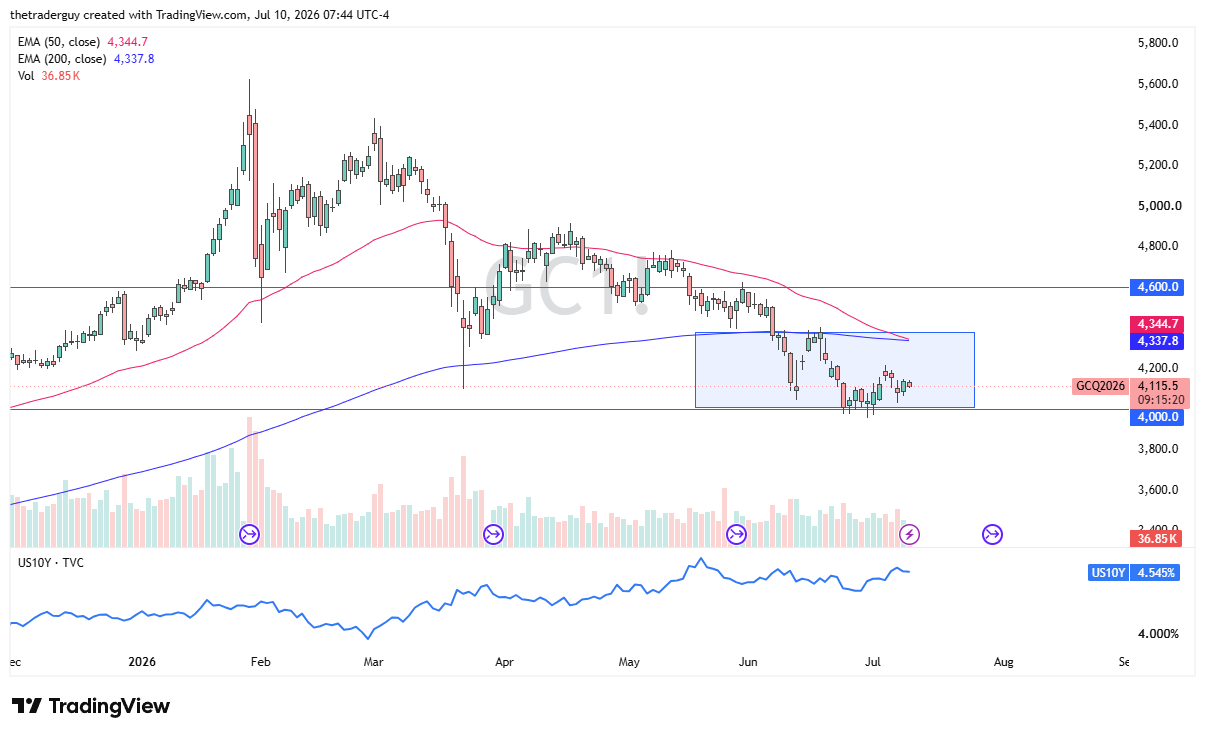
The gold market has drifted a little bit lower during the trading session on Friday, and what I find interesting is that every time we rally, there is a little bit of hesitation. Furthermore, we have the 50-day EMA breaking down below the 200-day EMA, which opens up the possibility of the so-called Death Cross kicking off, and longer-term traders will possibly be paying attention to it.

Key Technical Overhead and Dollar Strength Cap Upside Potential
The $4,000 level underneath is significant support, and I do think that a lot of people will watch that. If we were to break down below the $4,000 level, I think once you get below $3,900, then you start to see a significant drop, perhaps down to the $3,500 level. This is a market are that I think a lot of value hunters will be willing to take advantage of.
Ultimately, even if we do rally from here, I think the $4,200 level and the 200-day EMA both offer plenty of resistance. Until we see a weaker US dollar, I believe that the gold market will continue to struggle. This is probably going to be the case until the Middle East situation settles down, assuming it will.
Ultimately, this is a market that I think is more likely than not going to be sideways, and I think short-term traders probably continue to take advantage of this. But if you are looking to swing trade the gold market, you have to recognize that there is a significant amount of resistance just above that, which continues to be a major problem. Until the fundamentals change, I wouldn’t expect too much out of this market other than rallies struggling.
If you’d like to know more about how to trade gold and silver, please visit our educational area.



