It has almost been a year since the Volatility Index (VIX) -aka the fear index- has closed below 20.
It has almost been a year since the Volatility Index (VIX) -aka the fear index- has closed below 20. The two years before, it was mostly around the low to mid-teens. The last time the VIX closed below 20 was February 21, 2020. Does this mean there’s no complacency anymore in the markets and only fear?
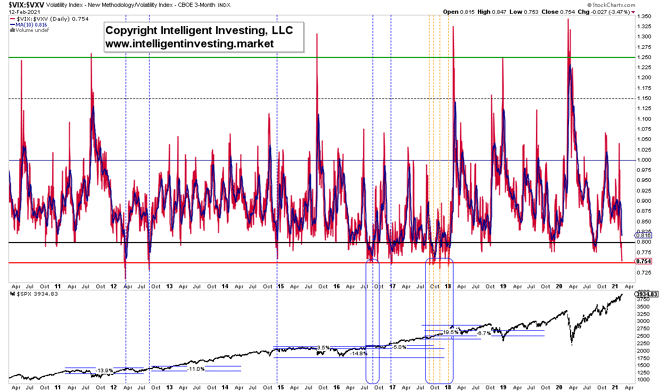
While the VIX is a real-time market index representing the market’s expectations for volatility over the coming 30 days, the lesser know VXV measures implied volatility three months out. One way to look at fear/greed is to use the VIX divided by the VXV: VIX/VXV ratio, as it filters out higher baseline readings liker now. See figure 1 below.
Figure 1. VIX/VXV daily ratio
High readings, i.e., spikes, coincide, clearly, with market bottoms as there is a lot of short-term “fear”; the VIX is very high. Since market bottoms form quickly, the ratio shows spike-highs. Conversely, when the readings become very low, i.e., traders and investors expect barely any volatility over the next 30 days, the market is -based on historical evidence since March 2009 low- close to a correction.
Low VIX/VXV readings and future market performance.
The current VIX/VXV ratio sits at 0.754. When the rate is about this low, vertical blue lines, returns for the S&P500 are often less than stellar. Namely, in 2012 the S&P500 lost 10-14% eventually. In 2015 the index stalled almost a year, adding a mere 3.5%, only to lose nearly 15%. Similarly, in 2016, albeit the pullback was shallow (-5%). In 2017 there were several<0.75 readings, and the market ignored those, gaining almost 20% since the first reading in August 2020 but losing at least 6% since the last<0.75 reading from December 2020. Besides, less low readings, like in 2018 and 2019, can still lead to 20% losses.
Thus, although the ratio is not precis in nailing the very top because as said tops take time, the current low readings warn that the S&P500 is closer to a significant, albeit interim, top, than a bottom. And as usual, “forewarned is forearmed.” IMHO, it does not mean to go full-on short or abandon all ships. It means one could, for example, raise stops, take partial profits, etc., which have never caused anyone any pain.
Dr. Ter Schure founded Intelligent Investing, LLC where he provides detailed daily updates to individuals and private funds on the US markets, Metals & Miners, USD,and Crypto Currencies