
Advertisement
Advertisement
NASDAQ 100 and Dow Jones 30 Forecast February 20, 2017, Technical Analysis
Updated: Feb 18, 2017, 04:39 GMT+00:00
NASDAQ 100 The NASDAQ 100 fell a bit during the day on Friday, but found support underneath to turn things around to form a hammer. It looks as if the
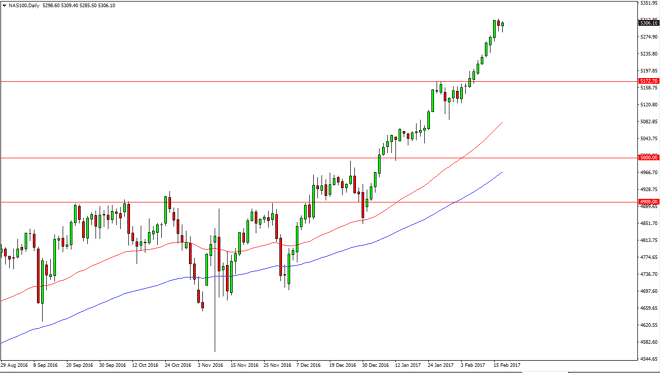
NASDAQ 100
The NASDAQ 100 fell a bit during the day on Friday, but found support underneath to turn things around to form a hammer. It looks as if the 5300 level will continue to support this market, and thus I believe that a break above the top of the hammer is a buying opportunity. Even if we break down from here, it’s likely that the market will find plenty of support.
Watch our NASDAQ 100 and Dow Jones 30 Video Forecast:
Dow Jones 30
The Dow Jones 30 fell a bit during the day, but I still think has plenty of support near the 20,500 level to keep the market afloat. Even if we did break down below there, the market has an absolute “floor” at the 20,000 handle. We are in an uptrend, and I have no interest in fighting that.
About the Author
Christopher Lewisauthor
Chris is a proprietary trader with more than 20 years of experience across various markets, including currencies, indices and commodities. As a senior analyst at FXEmpire since the website’s early days, he offers readers advanced market perspectives to navigate today’s financial landscape with confidence.


Advertisement