



Bargain-Hunters Looking to Improve Today’s Pre-Market Rally
The Nasdaq-100 Index and the S&P 500 Index are attempting a comeback early Friday after yesterday’s steep break drove the Nasdaq-100 Index into correction territory. The Dow is still under pressure. Bargain hunting and position-squaring are likely the catalysts for today’s technical bounce.
The sharp sell-off this week is likely being fueled by concerns over limited funding for data center construction following a major shift in Tuesday’s midterm elections. Democratic victories in both the House and the Senate and key state governor races are weighing on demand for AI stocks, although some are getting a boost early Friday.
Short-Selling Alone Is Not Likely to Shift the Bearish Tone
Professionals also blamed the sell-off on concentration risk, with a relatively small number of chip and AI firms controlling a major amount of market capitalization. In other words, over-leverage was a major cause of the break.
The stock indexes could mount a strong rally today if enough new money comes into the market to shift momentum to the upside. If today’s early price action is just aggressive short-covering, then the selling pressure is likely to resume later today.
The first wave down from a major top is usually long liquidation, so a fast counter-trend rally usually occurs to give short-sellers a better price to initiate new positions. That’s what we’ll be looking for in today’s session.
Daily December E-mini Nasdaq-100 Index Futures Technical Analysis
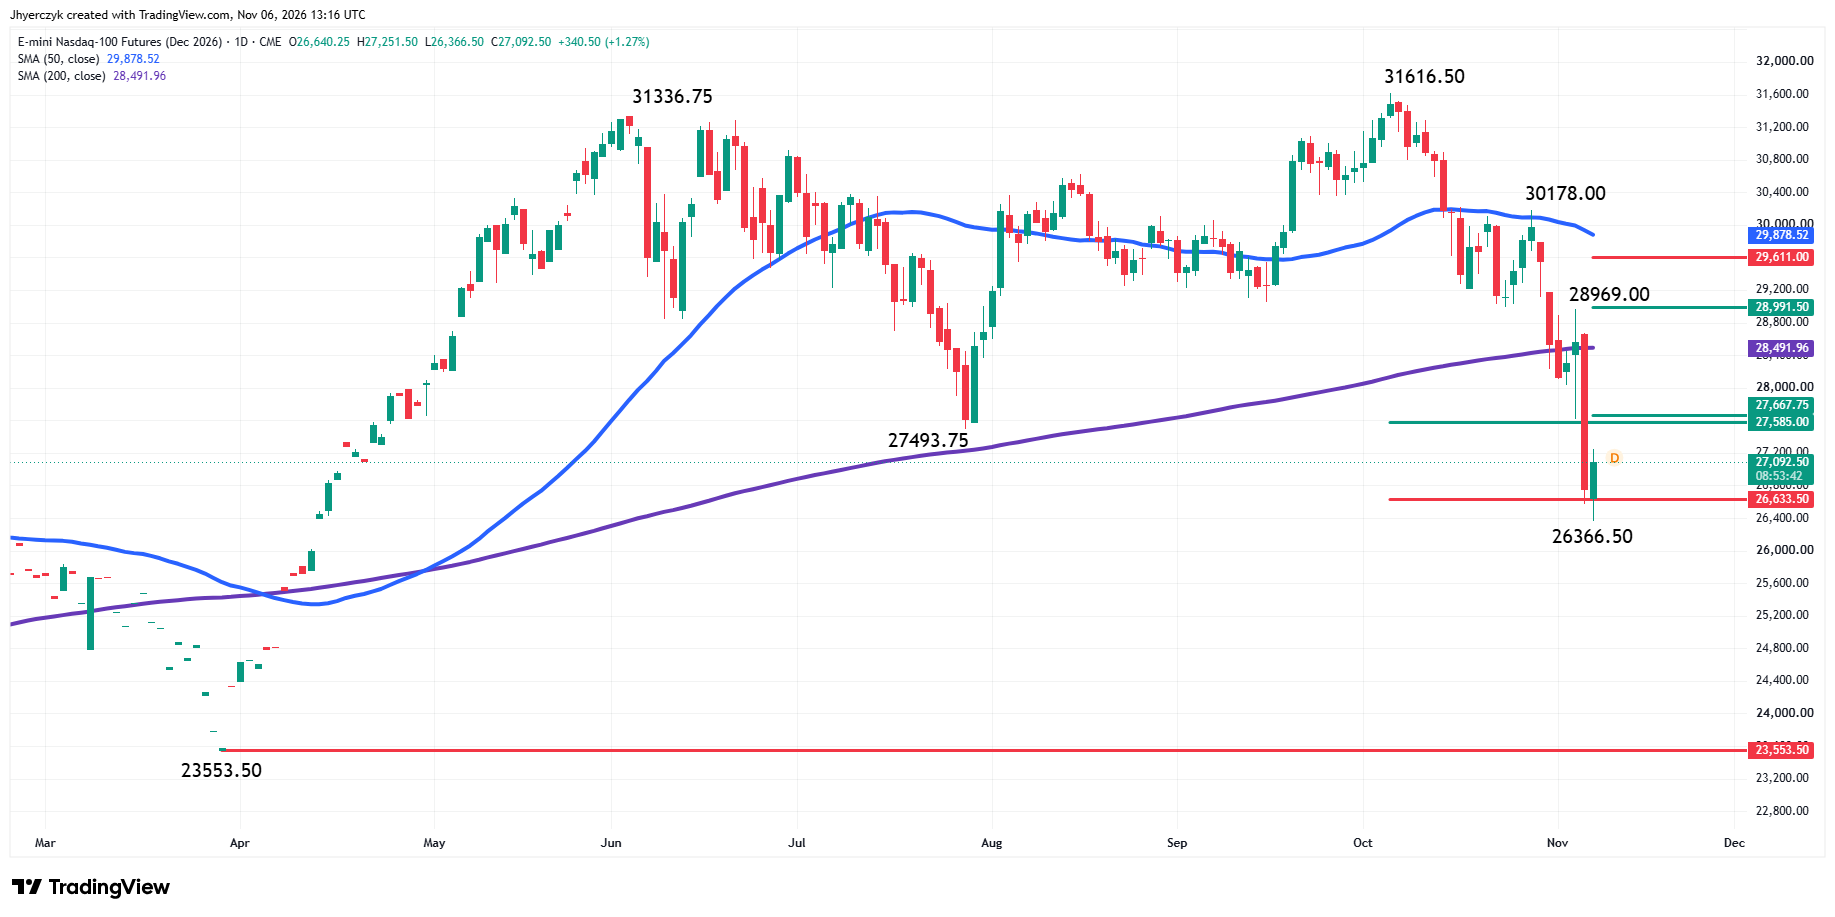
December E-mini Nasdaq-100 Index futures are trading higher shortly before the cash market opening. Overnight, the futures contract broke through the 61.8% level at 26633.50, reaching 26366.50 before turning higher. This put the index back inside the intermediate-term trading range, where traders may try to build a support base over the near-term.
The main trend is down according to the daily swing chart. A trade through the intraday low at 26366.50 will reaffirm the downtrend. Taking out the swing top at 28969.00 will change the main trend to up.
NASDAQ 100 Price Forecast
Every new NASDAQ 100 analysis as it publishes, today's technical signal and key levels, live price — on one page.
See all NASDAQ 100 forecastsThe minor range is 28969.00 to 26366.50. Its 50% level or pivot is 27667.75. The short-term range is 31616.50 to 26366.50. Its retracement zone is 28991.50 to 29611.00. The intermediate range is 23553.50 to 31616.50. Its retracement zone is 27585.00 to 26633.50.
The futures contract is trading on the bearish side of the long-term 200-day moving average at 28491.96. The 50-day moving average at 29878.52 is additional resistance.
Daily December E-mini S&P 500 Index Futures Technical Analysis
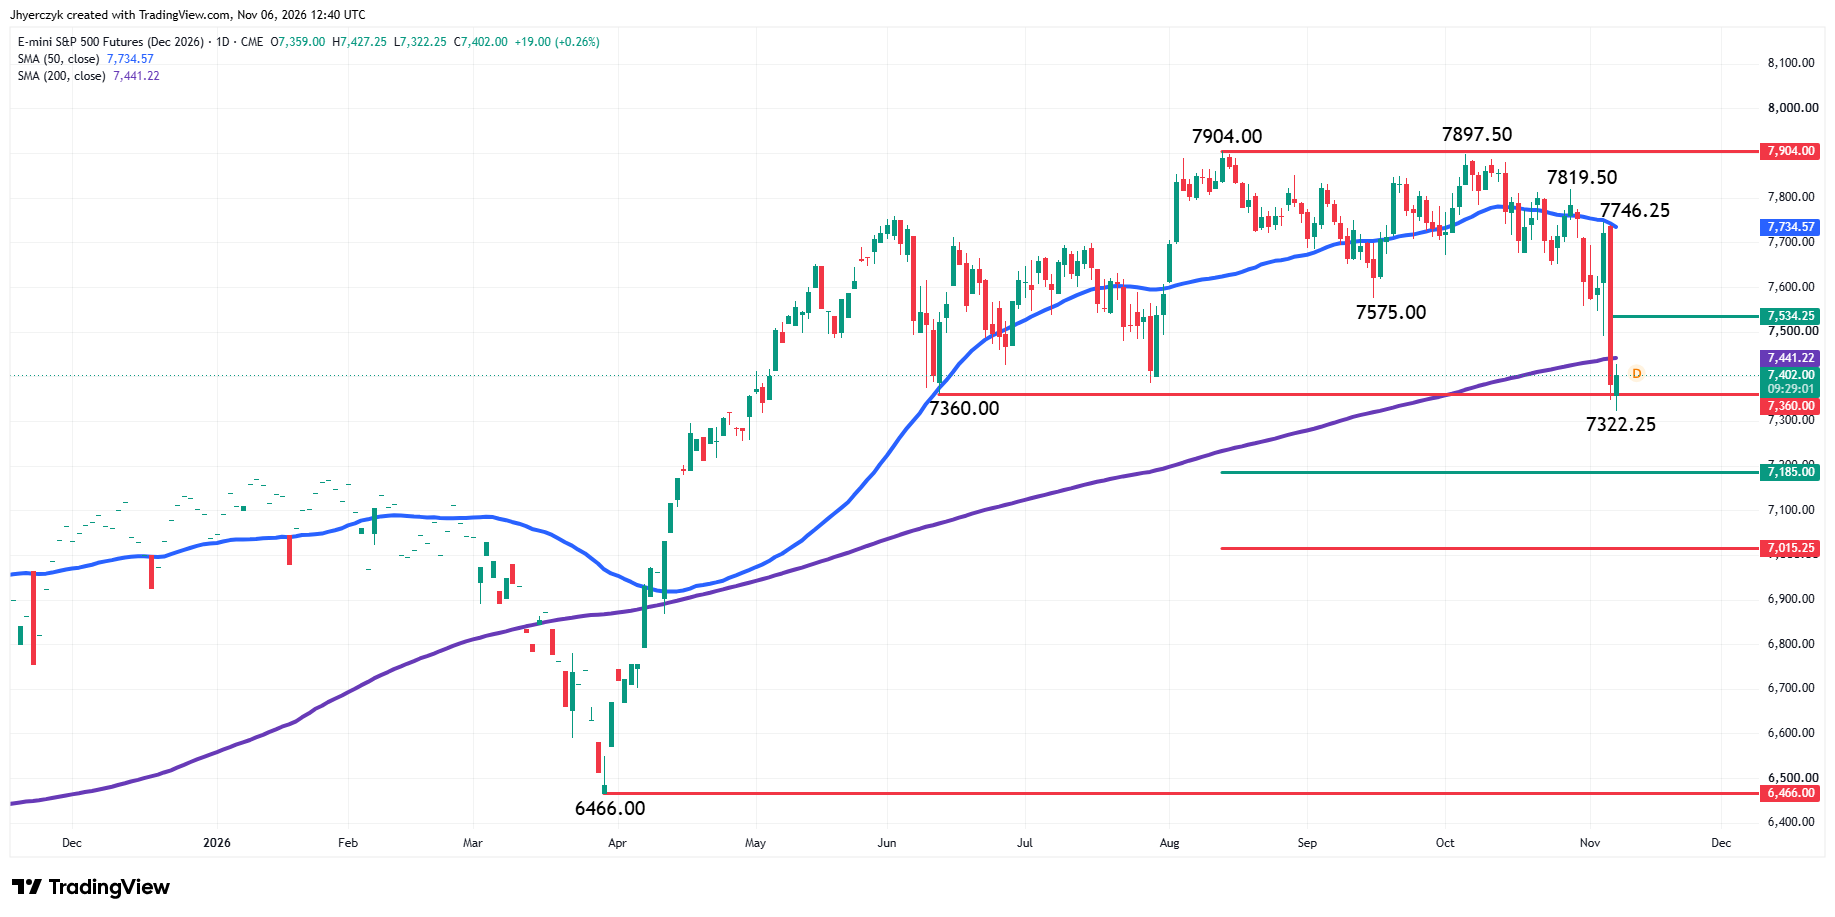
December E-mini S&P 500 Index futures are edging higher during Friday’s pre-market session after recovering from earlier weakness. Overnight, the futures contract broke through the June 11 main bottom at 7360.00 but quickly recovered it, where it currently sits.
The main trend is down according to the daily swing chart. A trade through the intraday low at 7322.25 will signal a resumption of the downtrend. The main trend will change to up on a trade through the last swing top at 7746.25.
The short-term range is 7746.25 to 7322.25. Its 50% level or pivot comes in at 7534.25.
The intermediate range is 6466.00 to 7904.00. Its retracement zone at 7185.00 to 7015.25 is the next major downside target area.
Today’s major objective may be recovering the 200-day moving average at 7441.22.
What to Watch
December E-mini Nasdaq-100 Index Futures
My outlook is bearish because the market is below both the 50-day and 200-day moving averages. The downtrend on the daily swing chart also supports my downside bias.
Trader reaction to the 61.8% level of the intermediate retracement zone at 26633.50 is likely to set the tone on Friday. A sustained move over this level could create the upside momentum needed to challenge the resistance cluster formed by the pair of 50% levels at 27585.00 to 27667.75. With the main trend down, sellers could return on a test of this area.
Overcoming 27667.75 and sustaining the move could weaken my bearish bias because it could generate enough momentum to challenge the 200-day moving average at 28491.96. Crossing over to the strong side of this indicator could cause me to shift my bias back to the upside.
If rallies are sold, then my downside bias will strengthen. A sustained move under 26633.50 will be a sign of weakness and renewed selling pressure. If it’s strong enough to take out the intraday low at 26366.50, then look for another steep plunge since the nearest support is the March 30 main bottom at 23553.50.
December E-mini S&P 500 Index Futures
Trading below the 200-day moving average is driving my bearish outlook early in the session on Friday. Recovering this long-term trend indicator will weaken my bias a little. This move could create enough upside momentum to challenge the short-term pivot at 7534.25.
Overcoming 7534.25 and sustaining the move will be a sign of strength and could bring the 50-day moving average at 7734.57 back in focus.
A sustained move under the 200-day moving average at 7441.22 will be the sign that supports my bearish bias. This could lead to a breakdown under the intraday low at 7322.25 and put the futures contract in a position to challenge the major retracement zone at 7185.00 to 7015.25.
Watch for a technical bounce on the first test of 7185.00 to 7015.25, but if the lower level fails, look out below. This move will put the March 30 main bottom at 6466.00 on the radar.
More Information in our Economic Calendar.