


NASDAQ 100 Technical Analysis
The NASDAQ 100 has shown itself to be a little bit negative in the early hours on Monday as we continue to threaten the 20,000 level. The candlestick from Friday was somewhat encouraging as it ended up forming a bit of a hammer, but if we were to break down below this hammer that would of course be a very negative turn of events, and it could lead to even further selling.
Otherwise, the short-term rally will have to deal with the 200-day EMA currently right at the 20,250 level, and then after that the 21,000 level where somewhere in that area, I would expect to see further selling pressure.

Dow Jones 30 Technical Analysis
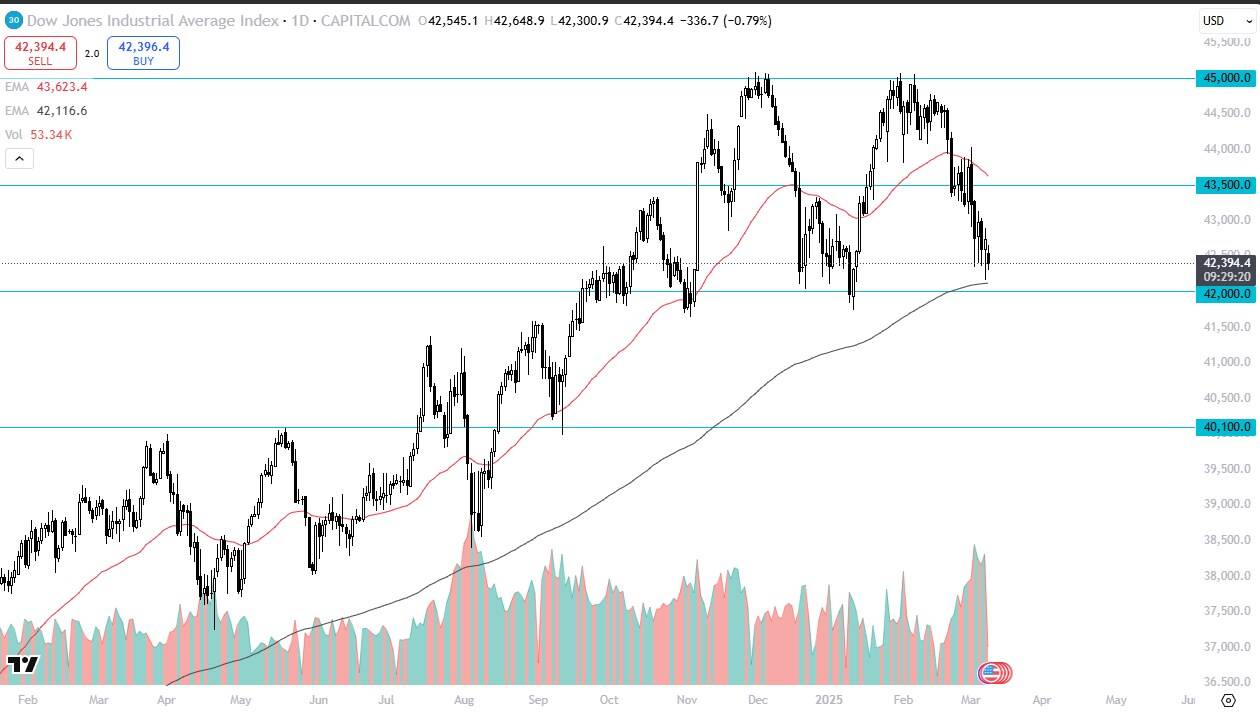
The Dow Jones 30 has pulled back just a bit during the trading session on Monday as well in the pre-market hours, but this index sends a slightly different signal as we are trying to hang on to the 200 day EMA, which is also backed up by the $42,000 level. At this point we are still technically at the bottom of the consolidation area, but obviously this is a market that you’ll have to be watching very closely as it does look like it’s going to really test the support.
S&P 500 Technical Analysis
The S&P 500 continues to drift around the 200 day EMA, as we are below the 5,800 level, an area that has been important for quite some time. And now we have to keep an eye on whether or not we can stay above the 5,600 level. Right now, it looks like we’re hanging around 5,700 and the 200 day EMA trying to sort this mess out.
It certainly looks like the S&P 500 could be threatened, too. It’s almost like we’re at a tipping point here. So, caution is probably the better part of valor in this market.
NASDAQ 100 Price Forecast
Every new NASDAQ 100 analysis as it publishes, today's technical signal and key levels, live price — on one page.
See all NASDAQ 100 forecasts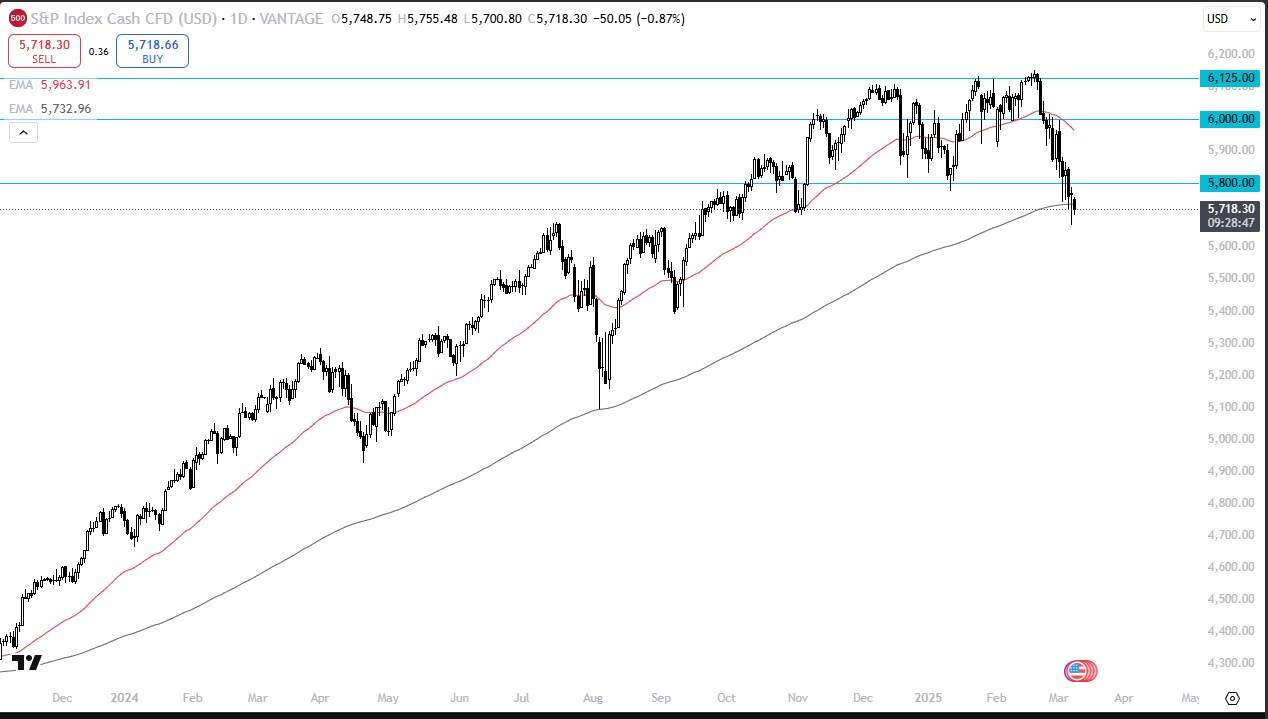
For a look at all of today’s economic events, check out our economic calendar.