


NASDAQ 100 Technical Analysis
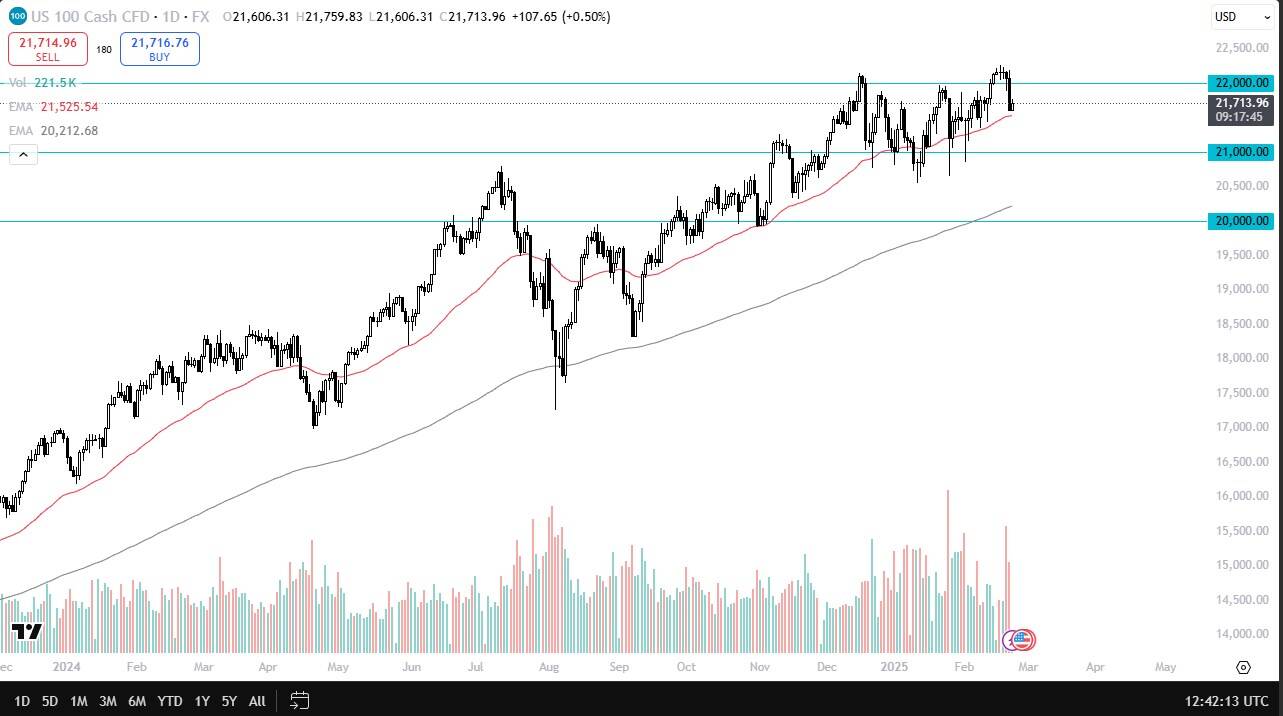
The Nasdaq 100 has shown itself to be slightly positive, and as a result, it looks like the 50 day EMA is offering support as a potential trend line. So, with that being said, the market is likely to continue to see a lot of grinding back and forth. And eventually the market could go looking to the 22,000 level, possibly even higher than that. I don’t have any interest in shorting the NASDAQ 100 and I recognize that there is support all the way down to the 21,000 level.
Dow Jones 30 Technical Analysis
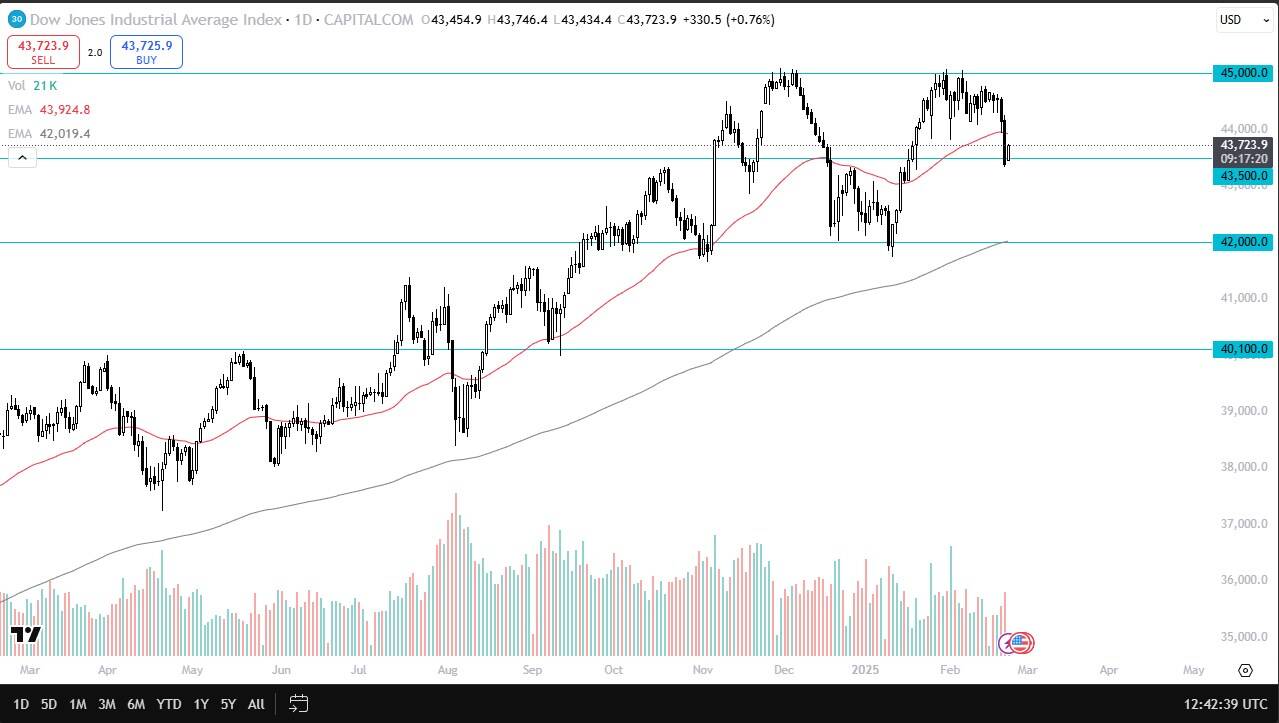
The Dow Jones 30 has seen the 43,500 level offer support after a couple of days of selling pressure. That being said, it is an area where we’ve seen significant resistance previously, and therefore I think you’ve got a situation where market memory comes into the picture.
If U.S. indices rally in general, then the Dow Jones 30 should follow right along. I’m still bullish on this market, I just recognize that it has been a laggard for a while, and I don’t know if that changes anytime soon.
S&P 500 Technical Analysis
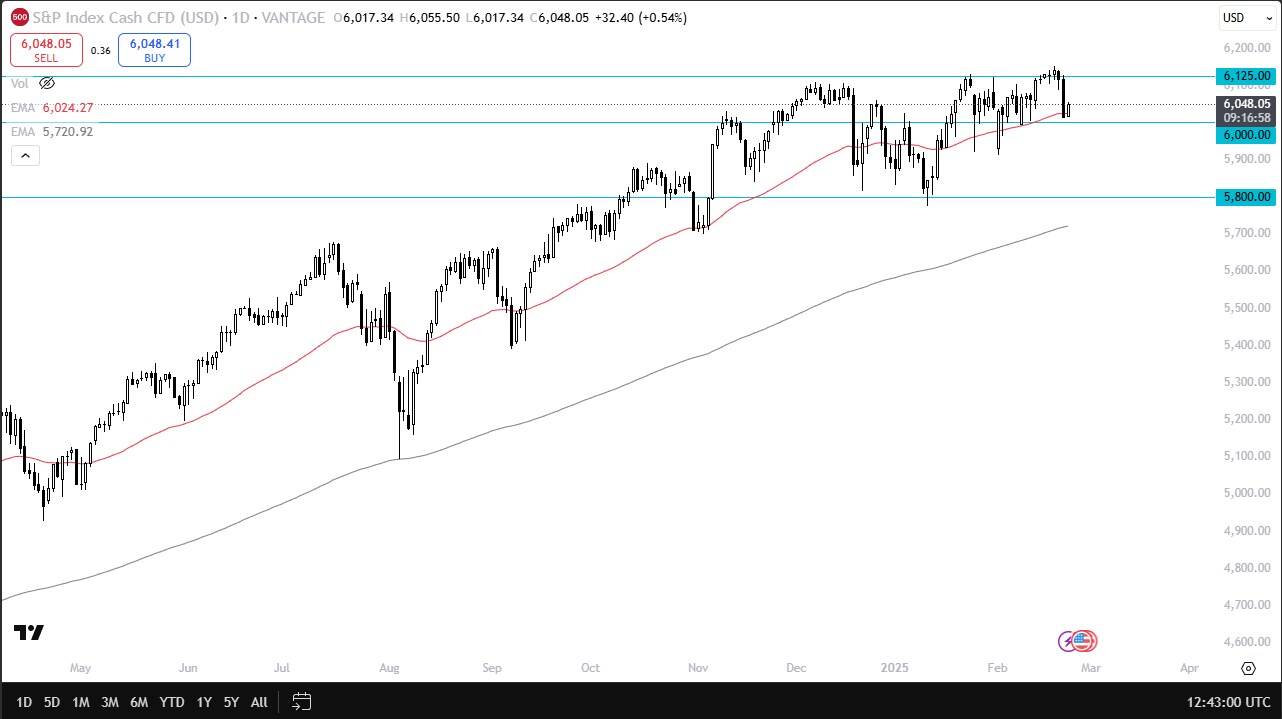
The S&P 500 has rallied a little bit during the trading session on Monday as the 6,000 level continues to be a significant support level. The 50-day EMA is offering a bit of support as well. And with that being said, I think there’s enough going on here that there is going to be some interest in buying the S&P 500.
NASDAQ 100 Price Forecast
Every new NASDAQ 100 analysis as it publishes, today's technical signal and key levels, live price — on one page.
See all NASDAQ 100 forecastsGranted, over the weekend, I read a couple of articles that called for Armageddon in the stock market, but you could have said that most weekends that ended with a down week previously over the last three years. I don’t know if much has changed at this point, and I think it’s still a buy on the dip scenario.
For a look at all of today’s economic events, check out our economic calendar.