


NASDAQ 100 Technical Analysis
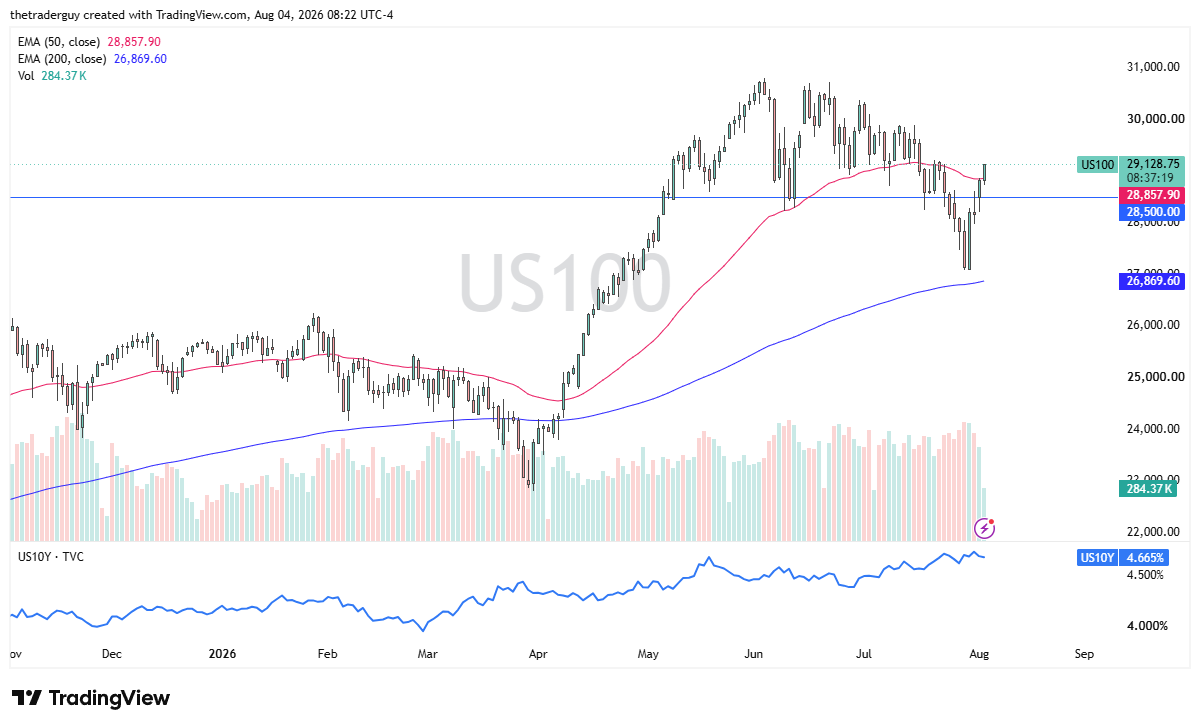
The Nasdaq 100 rallied a bit during the early part of the trading session here on Tuesday as we are now breaking above the 50-day EMA. That is worth paying close attention to. It’s a technical signal that people will be watching. The 28,500 level being broken to the upside was a good sign as it was previous support. Now, we’re back above it. That’s a good sign. It looks as if the buyers are starting to reenter the picture.

Dow Jones 30 Technical Analysis
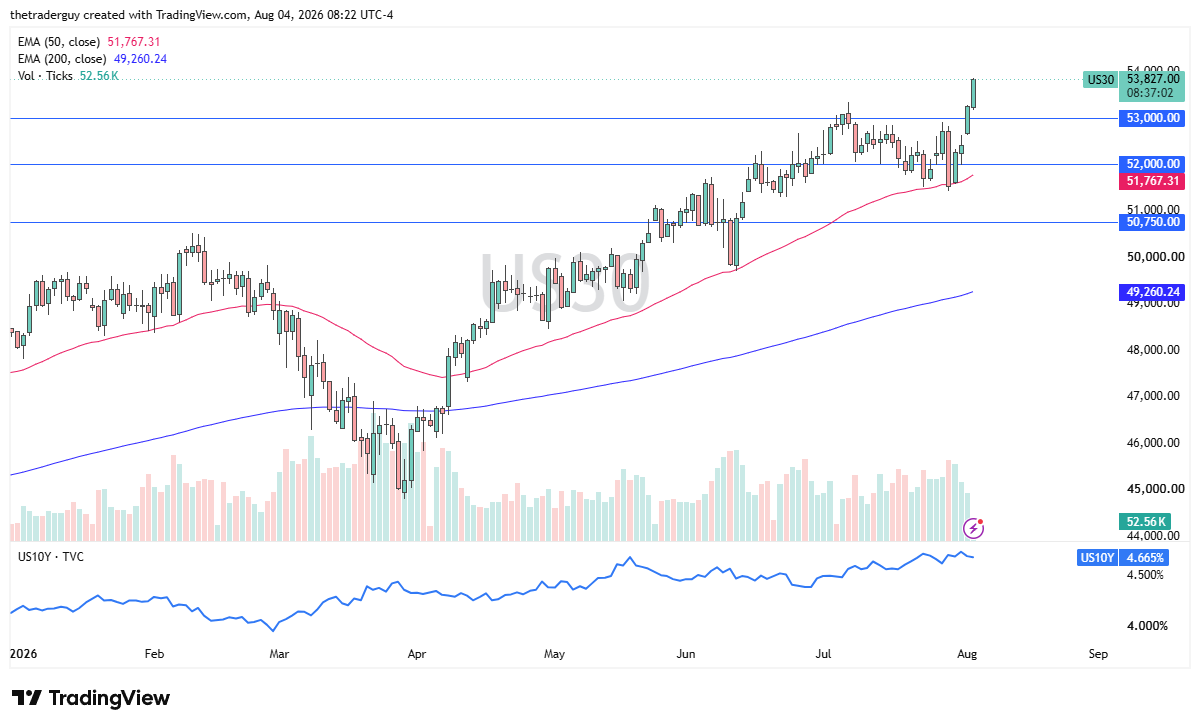
The Dow Jones 30 is at fresh new highs. It just continues to launch higher. Yesterday it was Boeing. We’ll see who it is today that drives this thing to the upside. The 53,000 level was significant resistance. Technical analysis would suggest that it should be a bit of support on the pullback. We’ll just have to wait and see. The 50-day EMA underneath has acted as a nice trend line, and now we are getting fairly close to the top of what could be a channel. Watch that, but in general, this is a very bullish market.
S&P 500 Technical Analysis
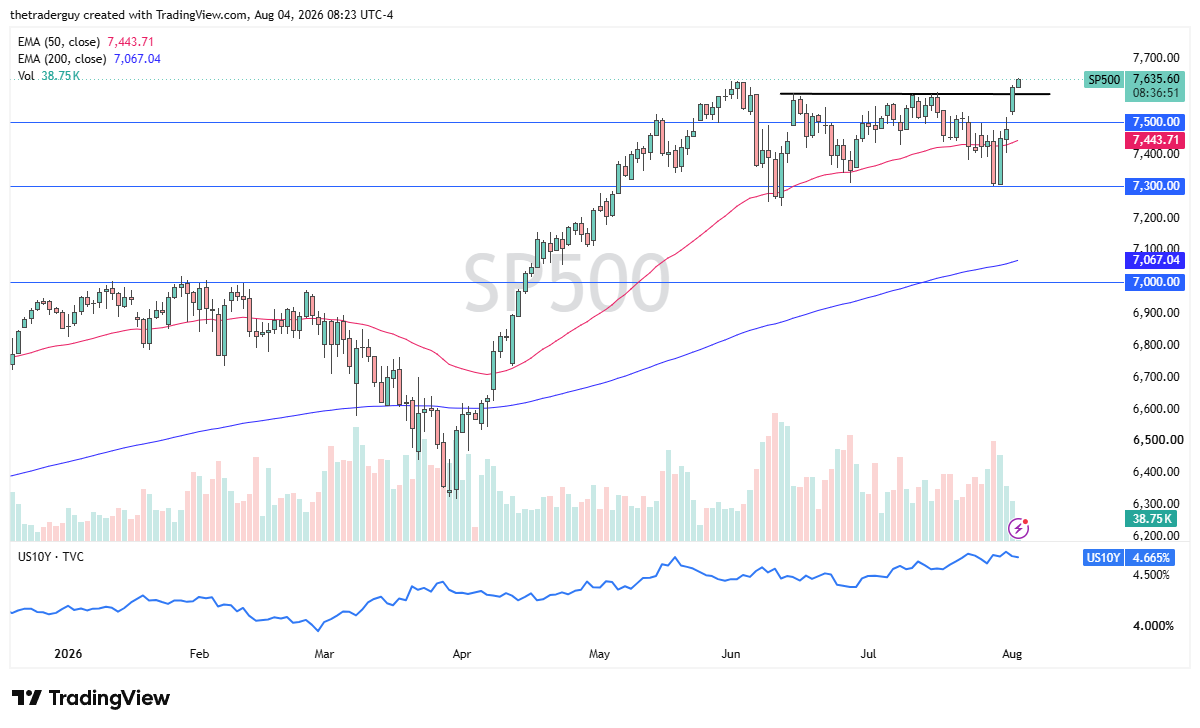
The S&P 500 is breaking out. It broke above that crucial 7,600 level and now is right on the precipice of making fresh all-time highs. Again, stocks in America celebrate the idea that perhaps the Federal Reserve may have to cut rates, although the bond market doesn’t seem to think so. We’ll just have to wait and see.
Either way, earnings have gone okay, and that provides more fuel to the fire based on technical analysis and the measured move of this rectangle possibly being broken to the upside. 7,900 could be the target. Short-term pullbacks, more likely than not, I suspect will attract buyers in what has been a strong uptrend.
If you’d like to know more about chart patterns and how to trade them, please visit our educational area.


