


NASDAQ 100 Technical Analysis
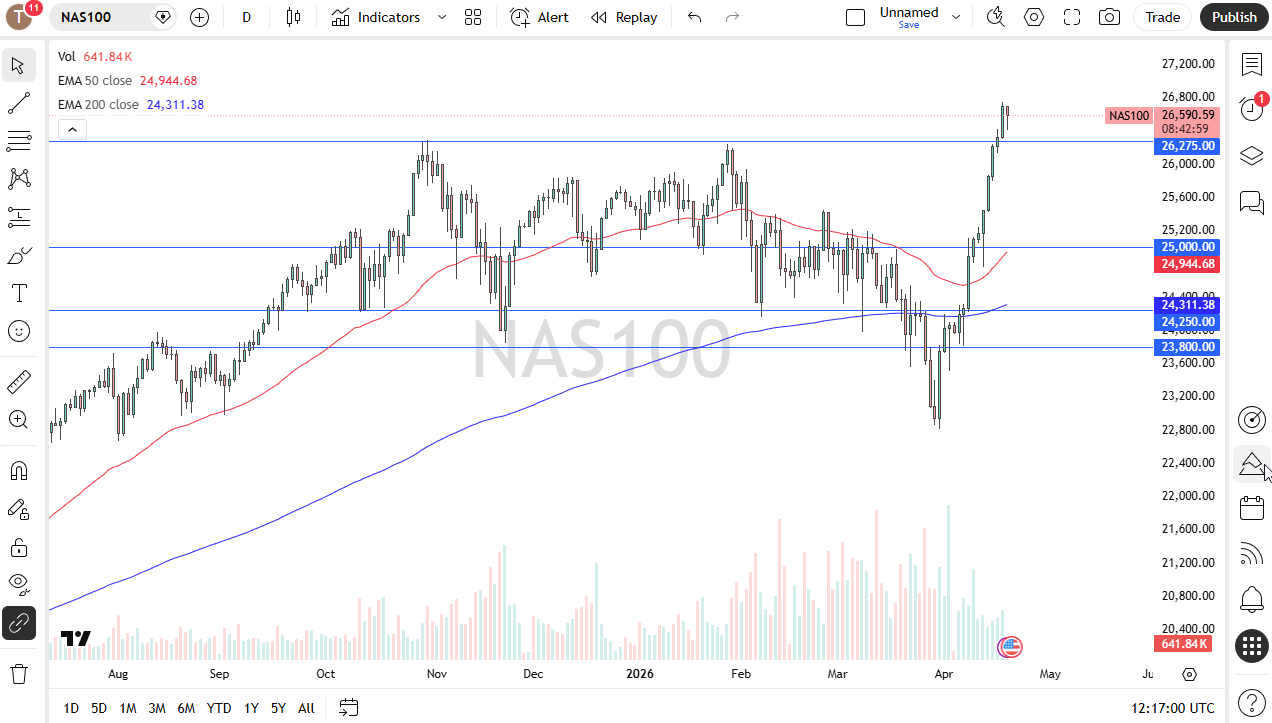
The Nasdaq 100 fell a bit during the open on Monday, but it looks as if we are trying to hang on to the upside anyway. The 26,275 level is an area that previously had been resistance; it should now be supported. Ultimately, this is a market that I think that short-term pullbacks continue to be buying opportunities that people may take advantage of, only to perhaps grind sideways for a while to work off some of the excess froth.
This is all driven by headlines coming out of the Middle East and what’s going on in the bond markets. As things have gotten a little testier over the weekend, it makes sense that the Nasdaq 100 had dropped. That being said, it is pretty resilient.
Dow Jones 30 Technical Analysis
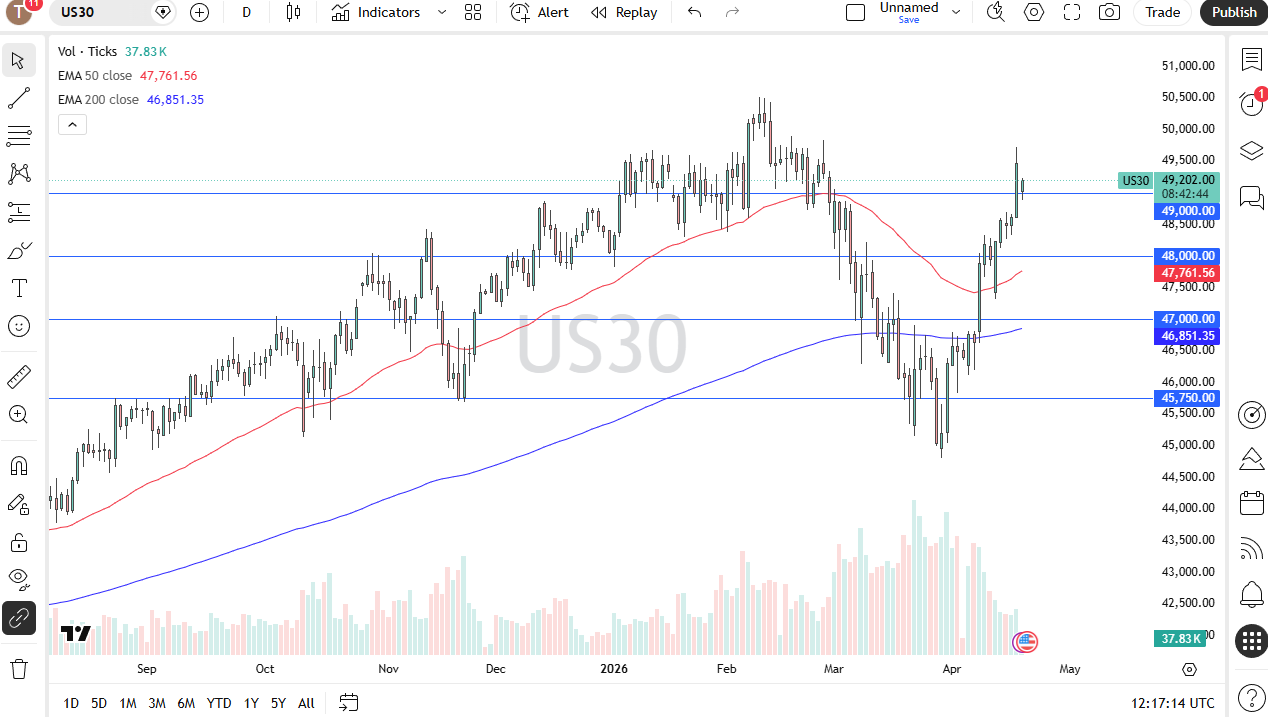
The Dow Jones 30 gapped lower but has found the area right around 49,000 to be important enough support to keep the market afloat. The market bouncing from here opens up the possibility of another attempt to get to 50,000, which I think happens eventually.
But you also have to keep in mind there’s a lot of noise out there, so we don’t really know what to expect next other than there’s going to be a lot of erratic behavior. Therefore, position sizing will be crucial.
S&P 500 Technical Analysis
NASDAQ 100 Price Forecast
Every new NASDAQ 100 analysis as it publishes, today's technical signal and key levels, live price — on one page.
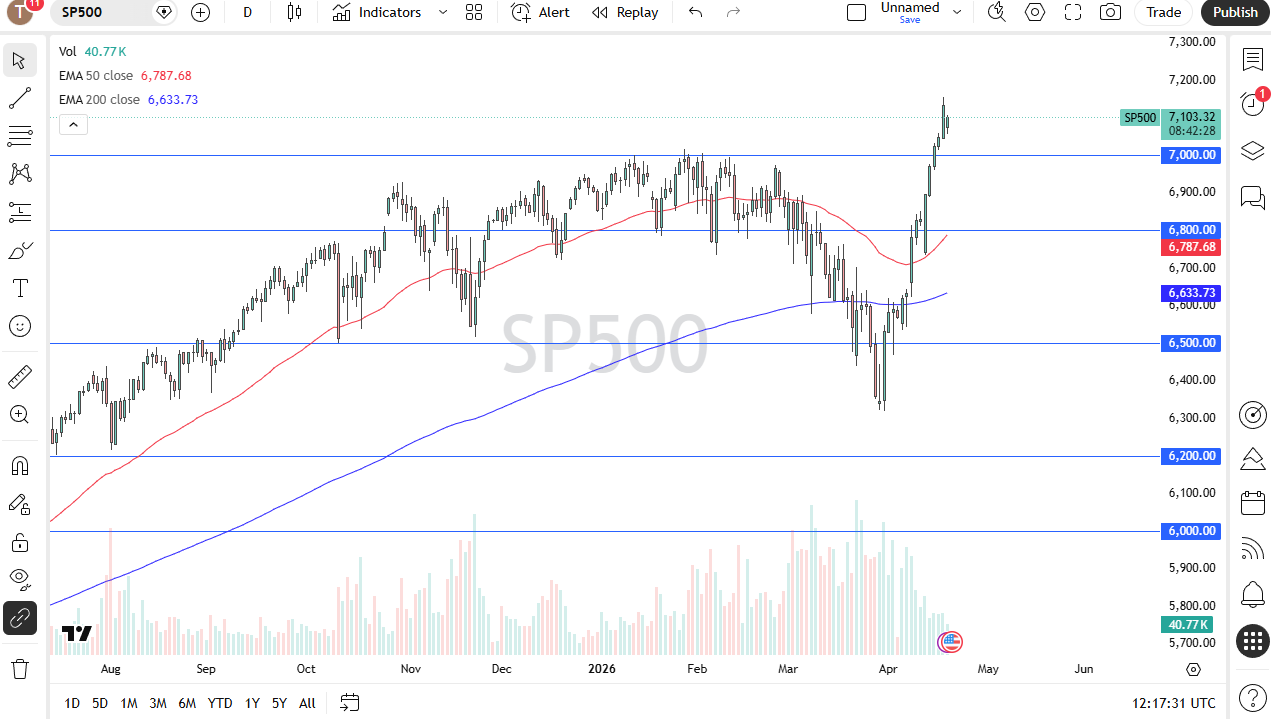
See all NASDAQ 100 forecastsThe S&P 500 gapped lower to kick off the trading session on Monday, as well, but has also turned around. Despite the fact that we are still negative in this index as well, it does show that it doesn’t want to fall apart, and that is pretty important. The 7,000 level should continue to be support and as long as that’s the case, I think we’ve got a shot at making a little bit of money to the upside.
That being said, keep an eye on the headlines; they could change anything at any given moment. This is an overbought market, though, so I think ultimately, really what we need to see is sideways action.
If you’d like to know more about chart patterns and how to trade them, please visit our educational area.